2022
#Research, #Discursive Design
Stuck in the Middle
This project was conducted during the start of my MDes program’s first semester while I was still located in the Philippines due to VISA issuance delays in the Covid-19 pandemic. It is a data visualization of one’s planned schedule in contrast to their lived time while working in one time zone and living in another.
Overview
Collecting data about one’s life becomes a ritual which allows for in-depth awareness and reflection. Through visualization of this information, it further allows a deeper level of connecting with everyday activities.
By still being in the Philippines upon the conduct of this project, but already having started MDes classes in Vancouver time, it was a challenge adjusting one’s body clock to two time zones—preparing for class at around 11pm at night, finishing by 6am, trying to sleep until noon, doing projects in the afternoon, and repeating the cycle for the next class. I conducted a self-reflective tracking practice to visualize the amount of actual sleep and work time I end up doing and comparing my lived time to strict schedules on my calendar.
Process
Visualizing collected data
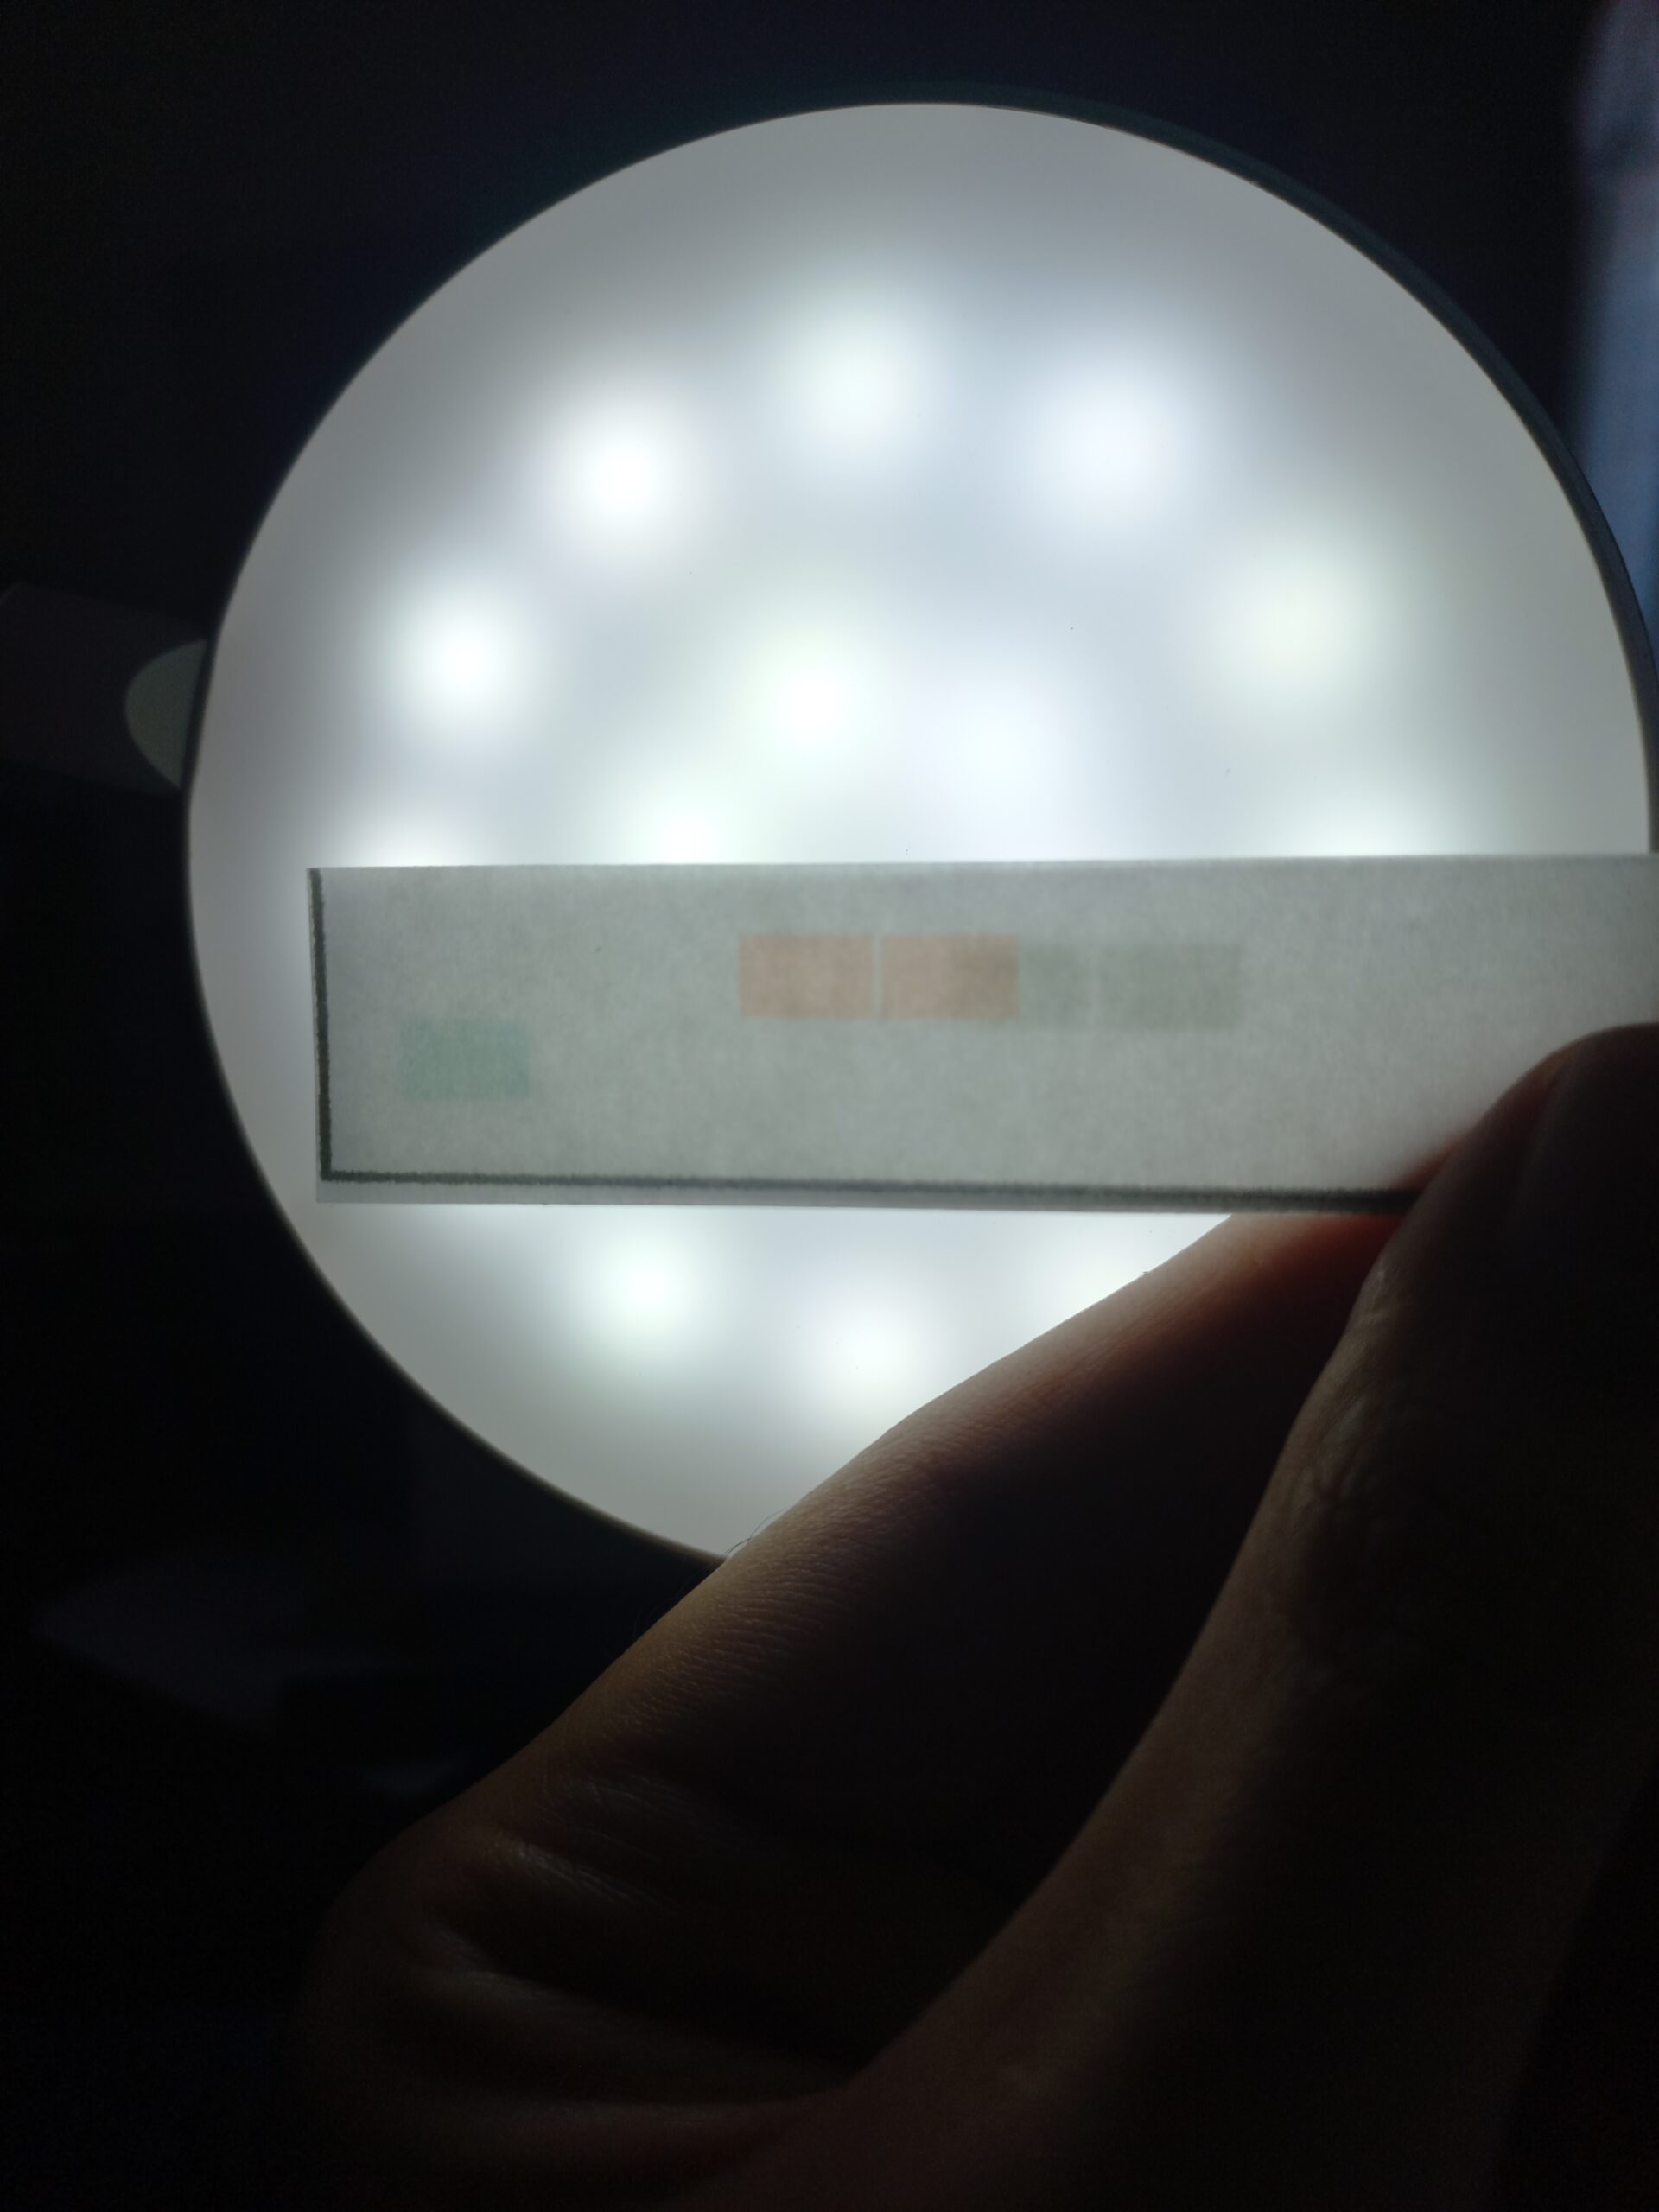
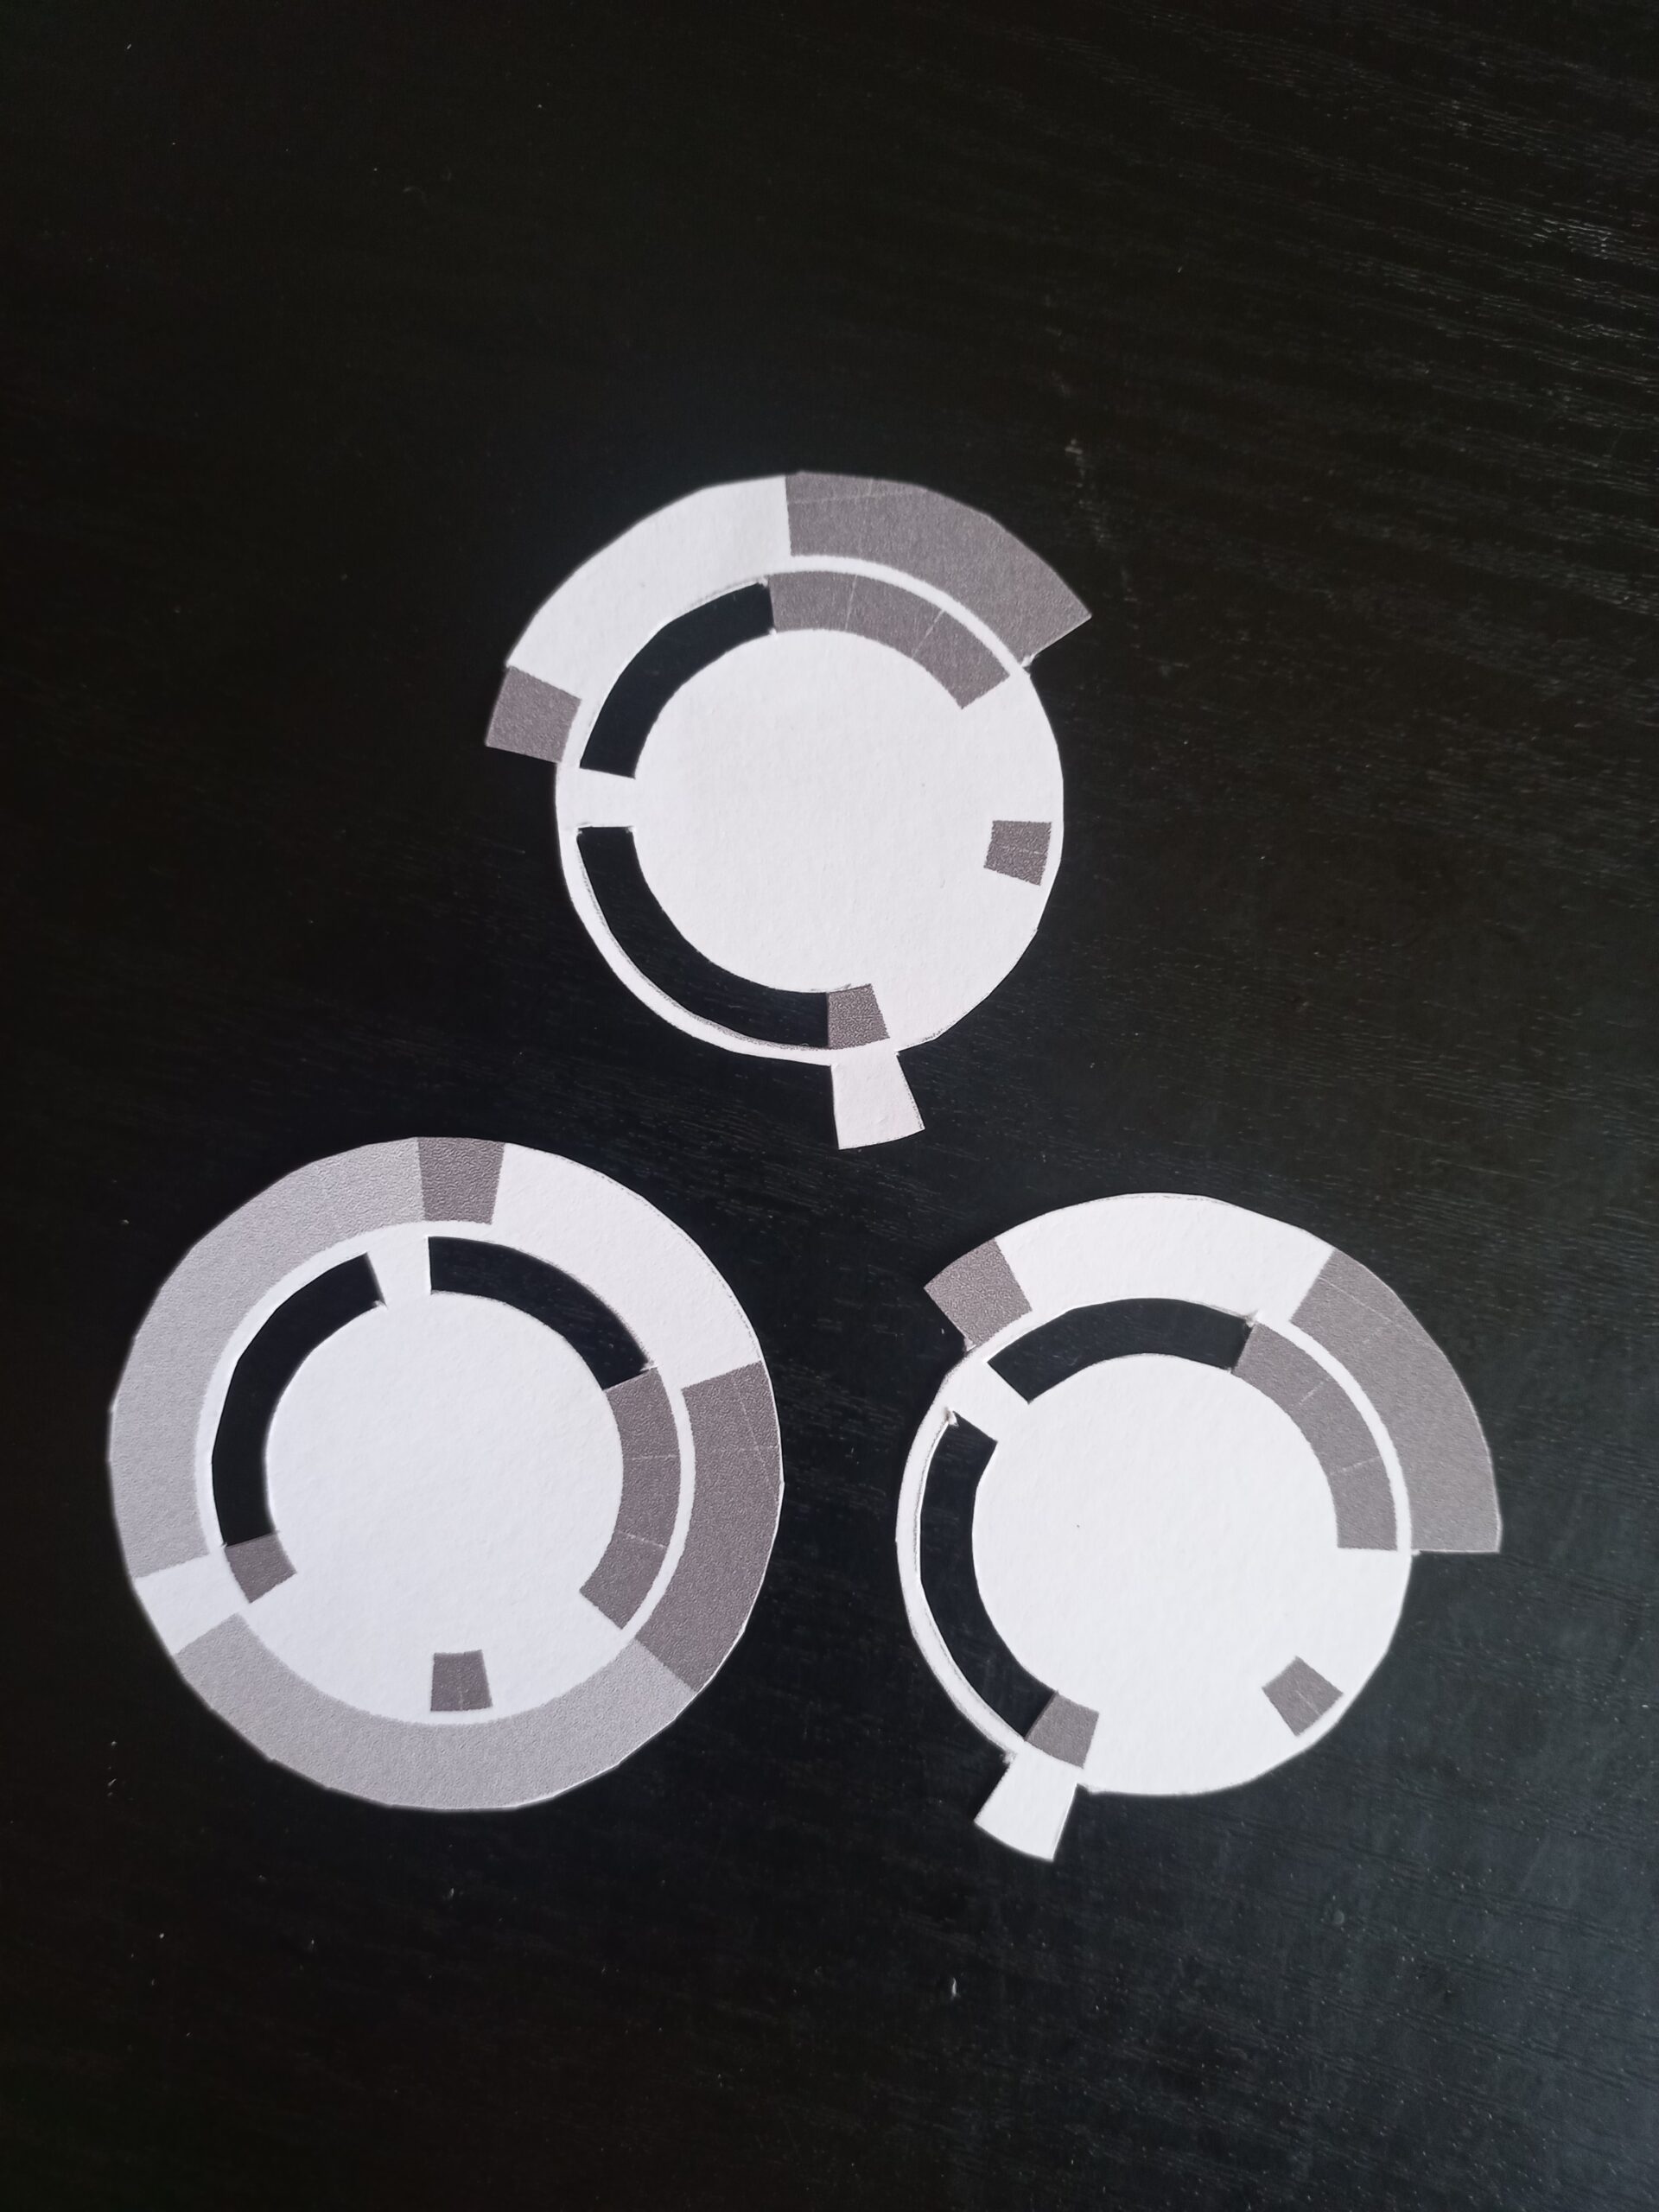
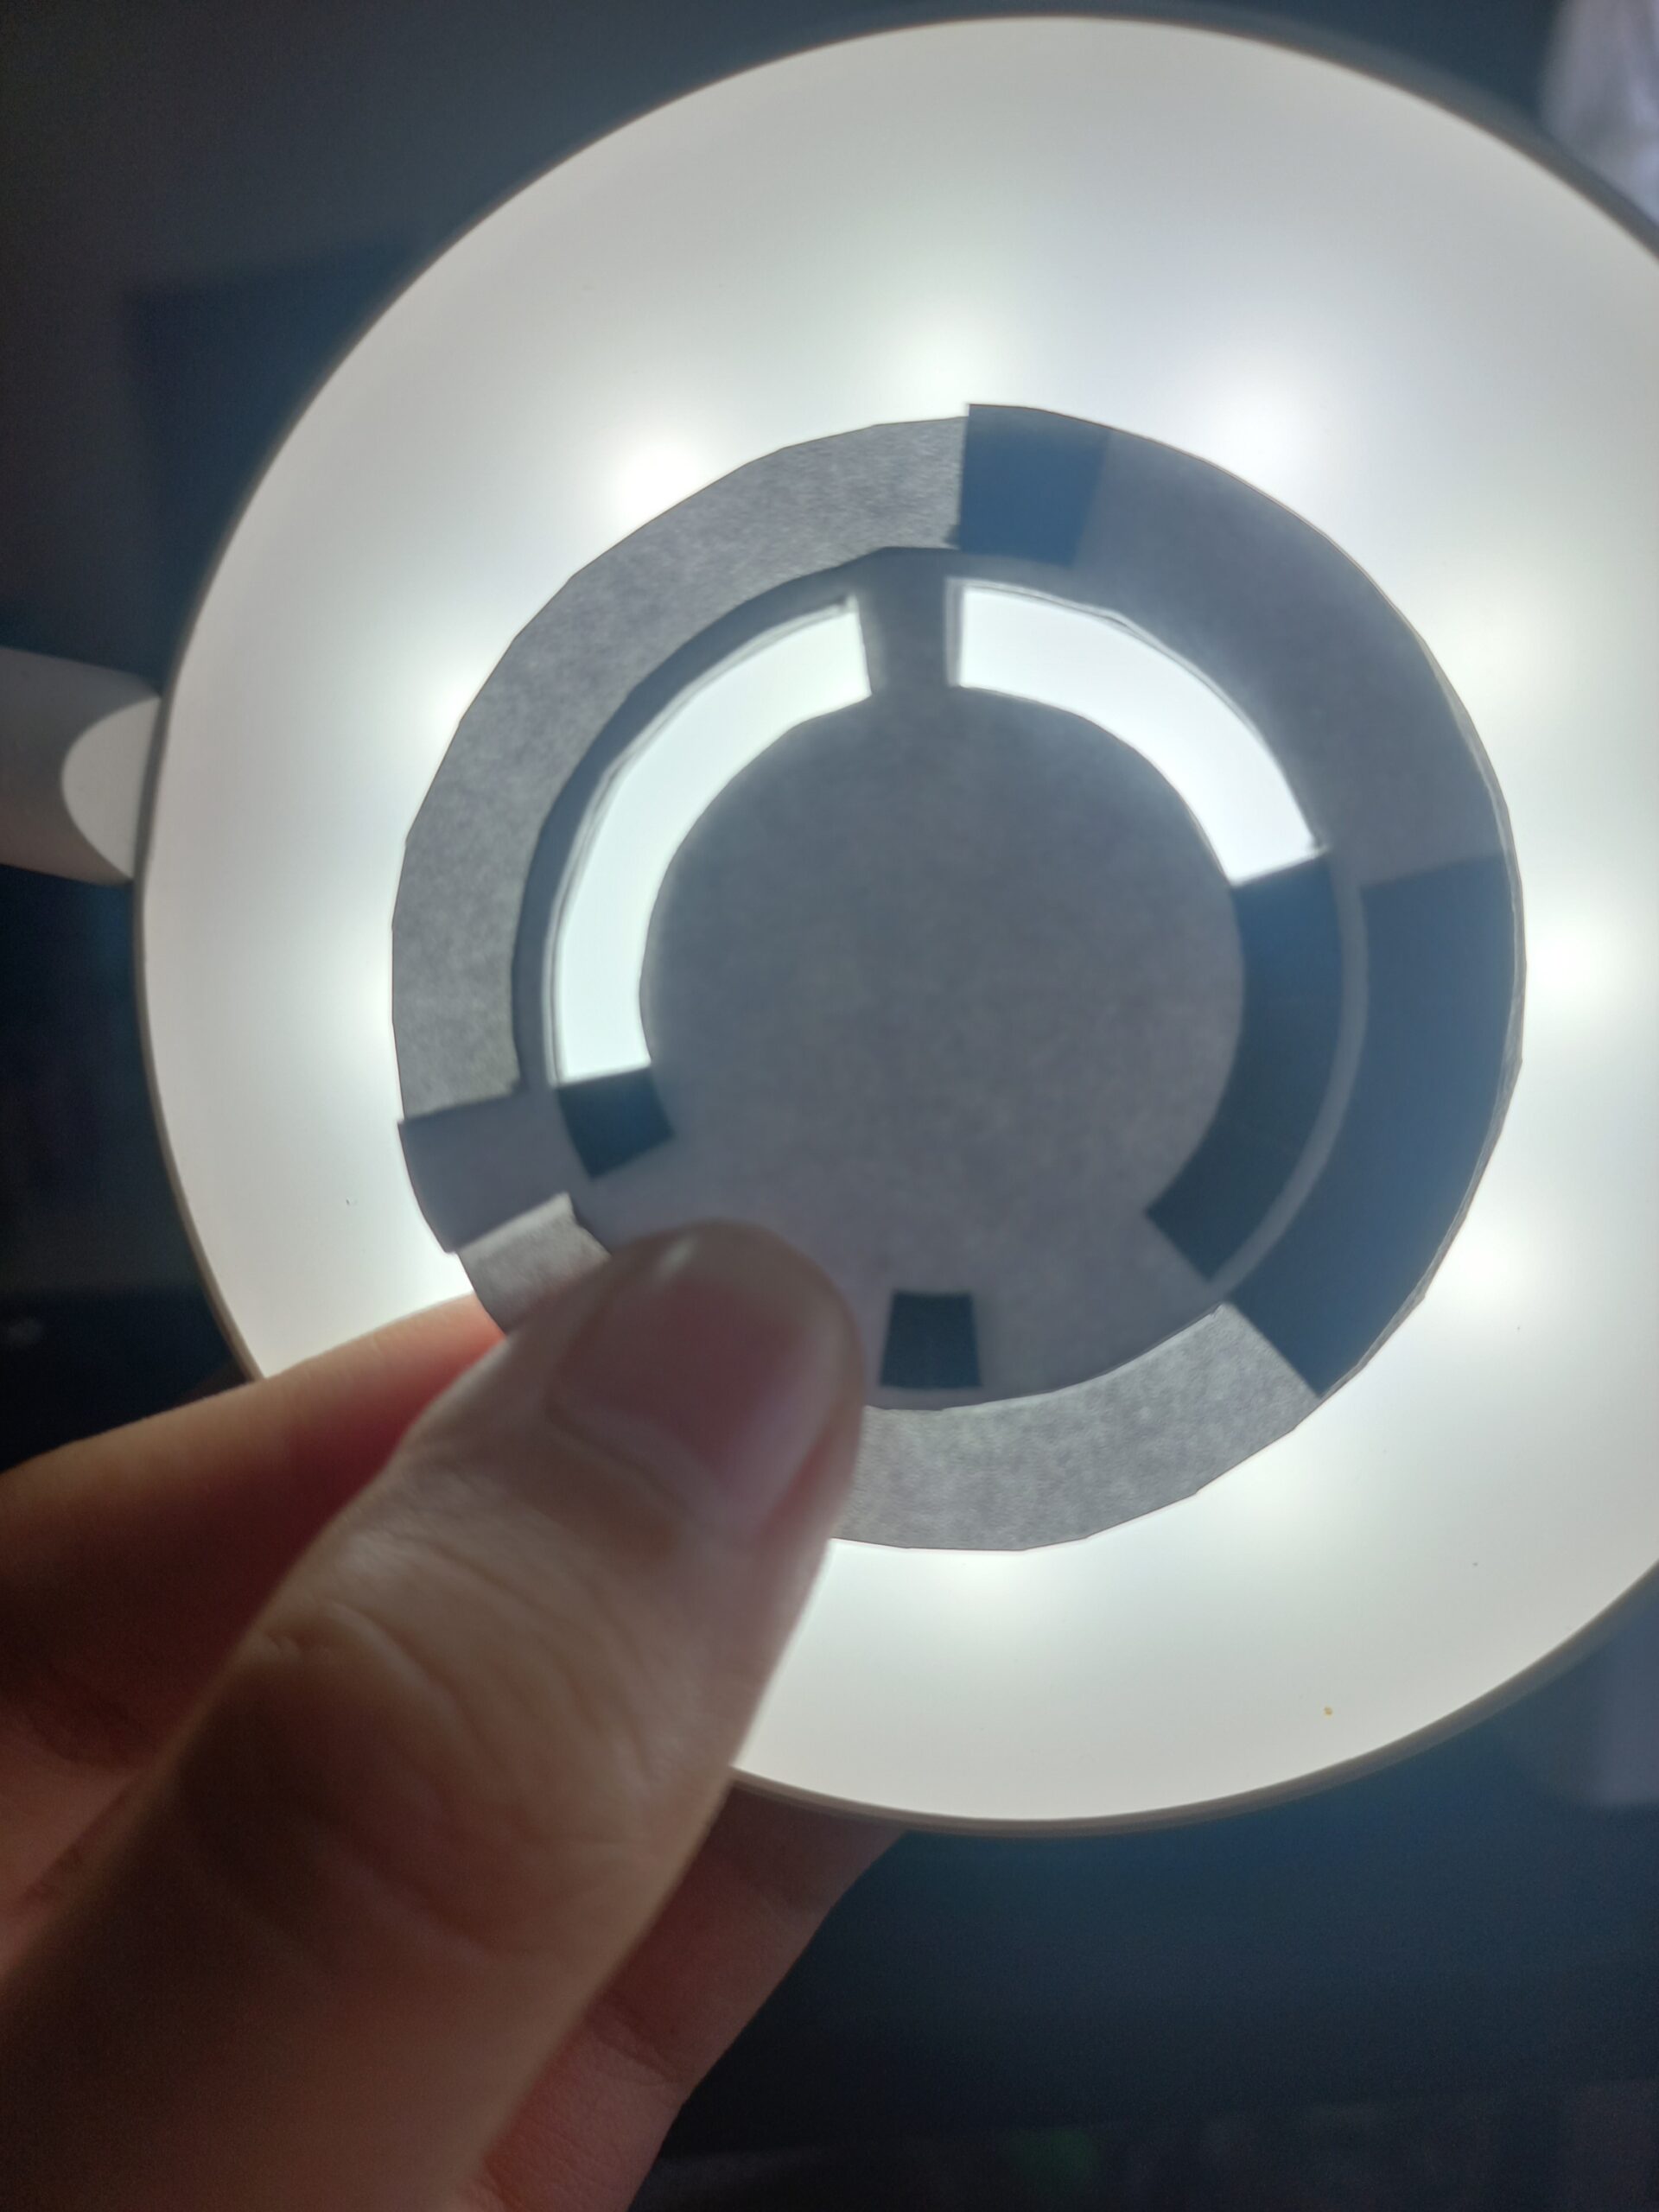
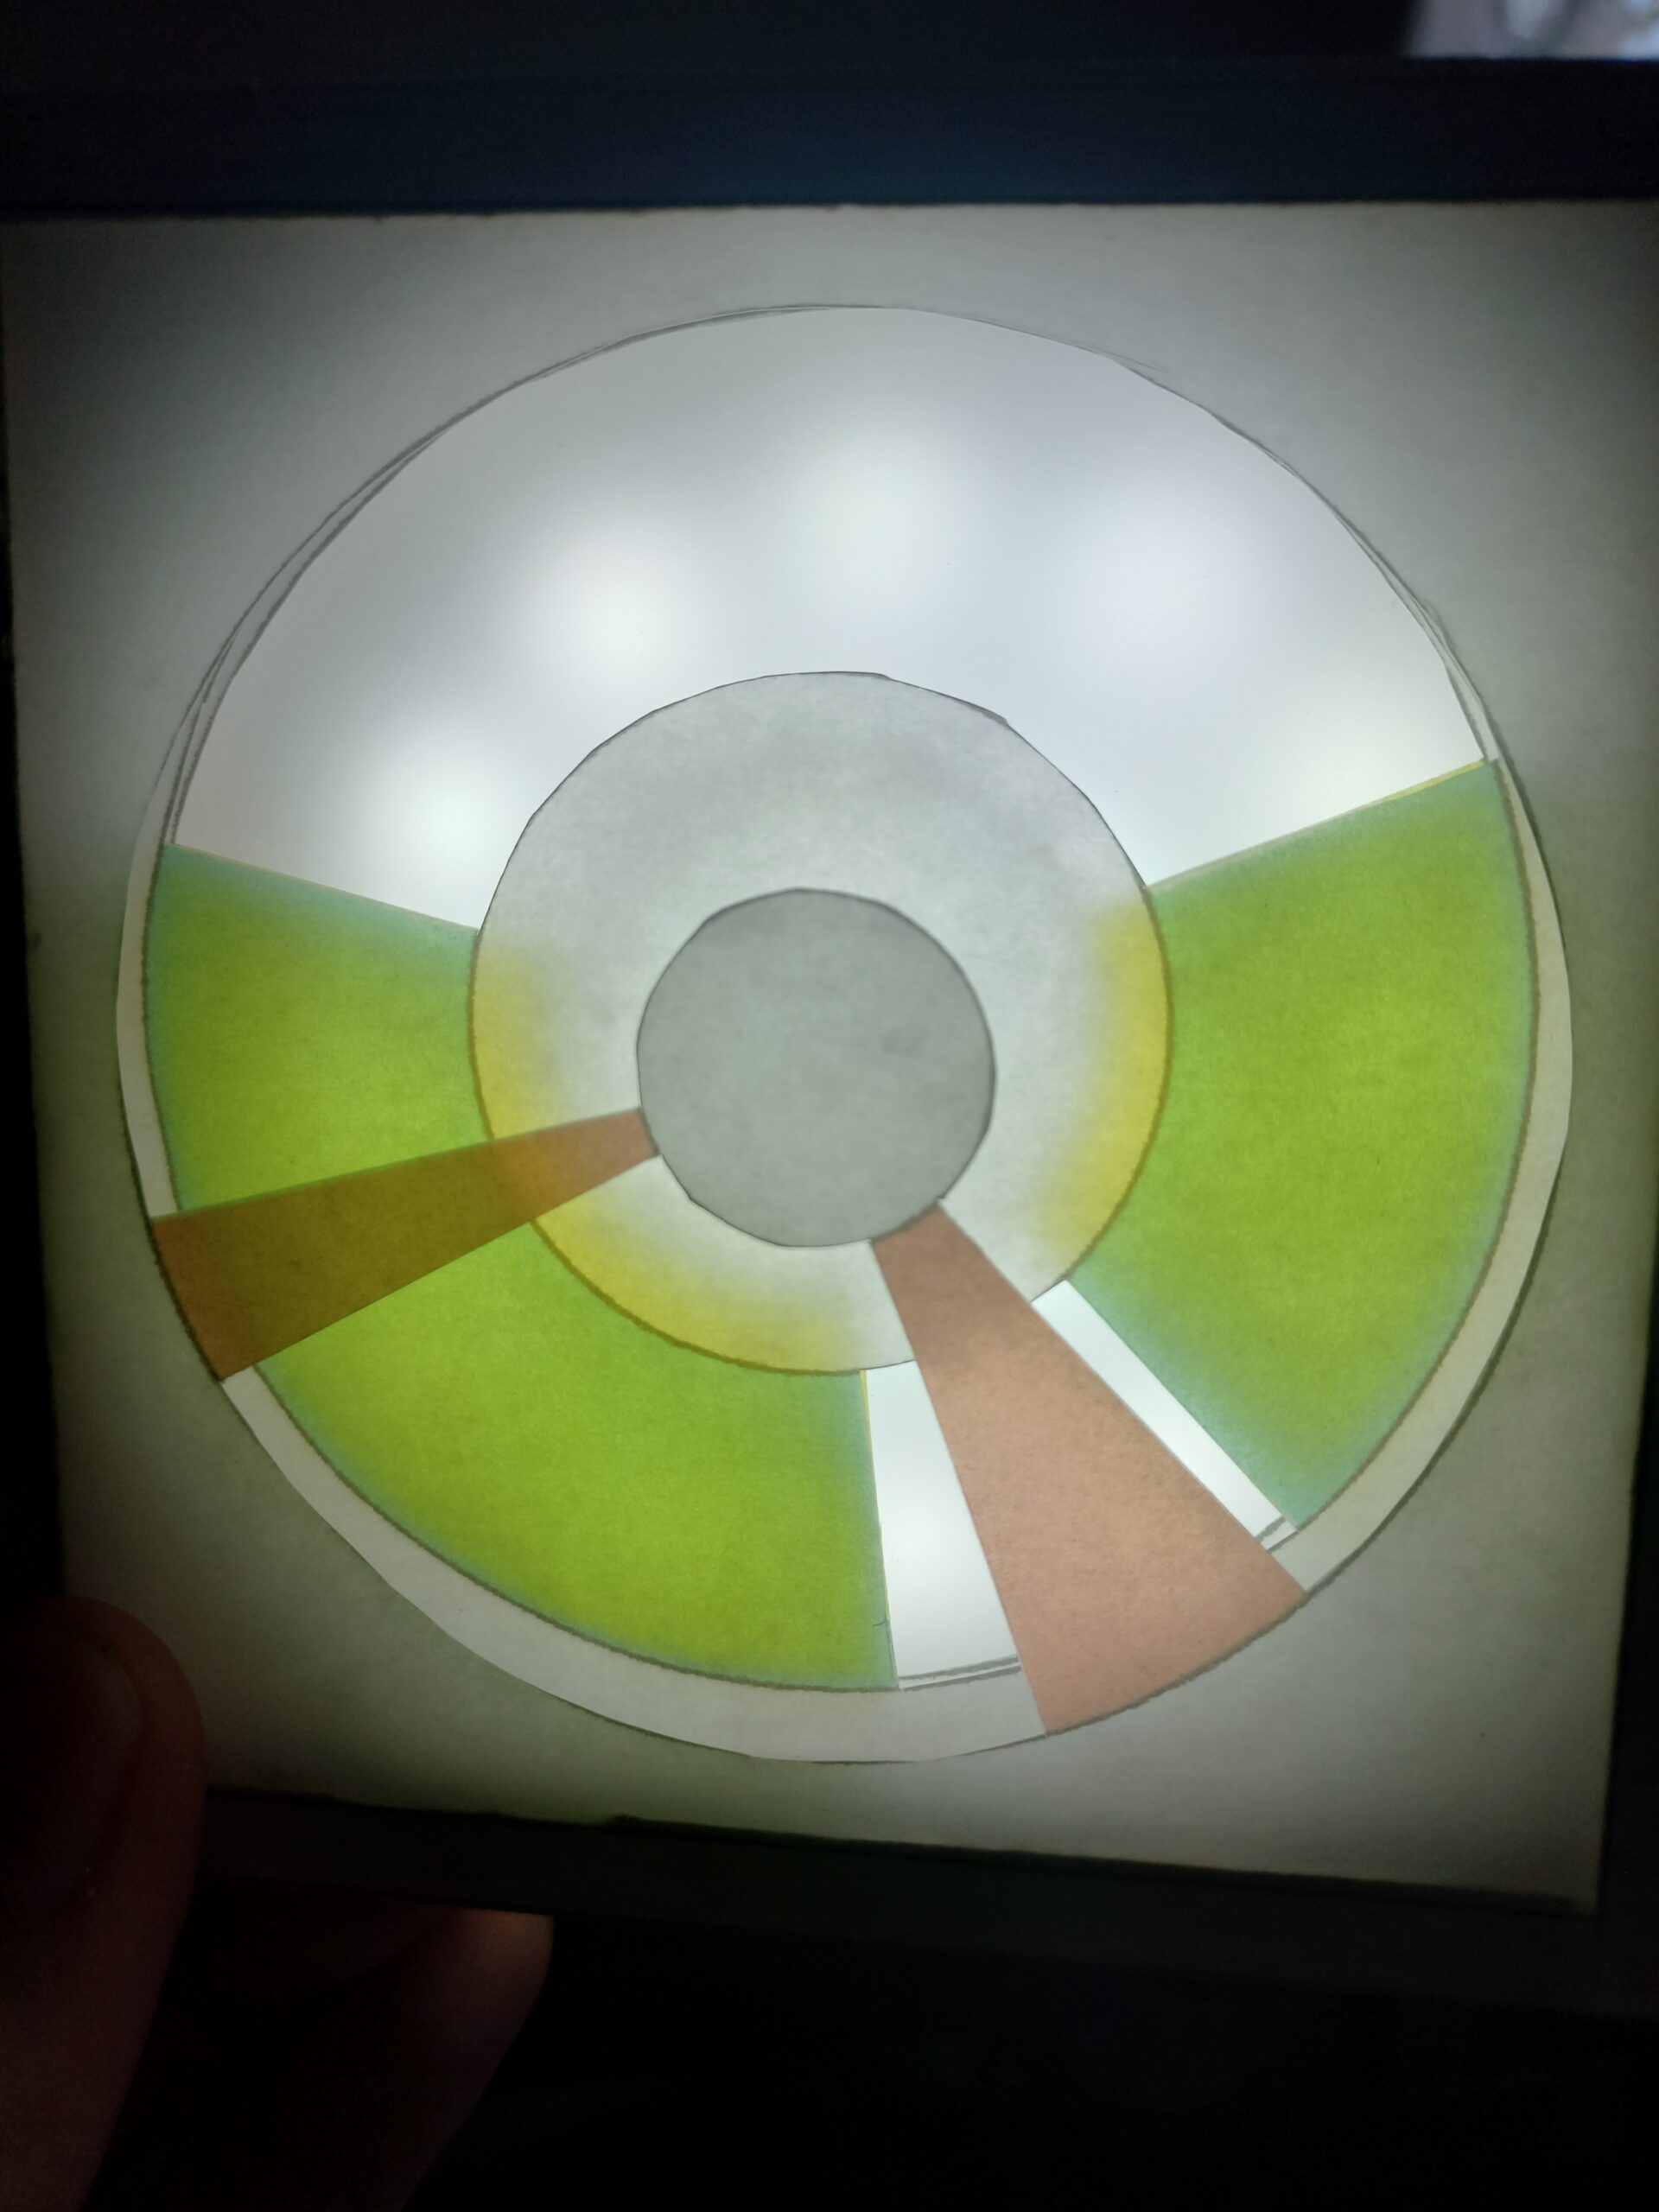
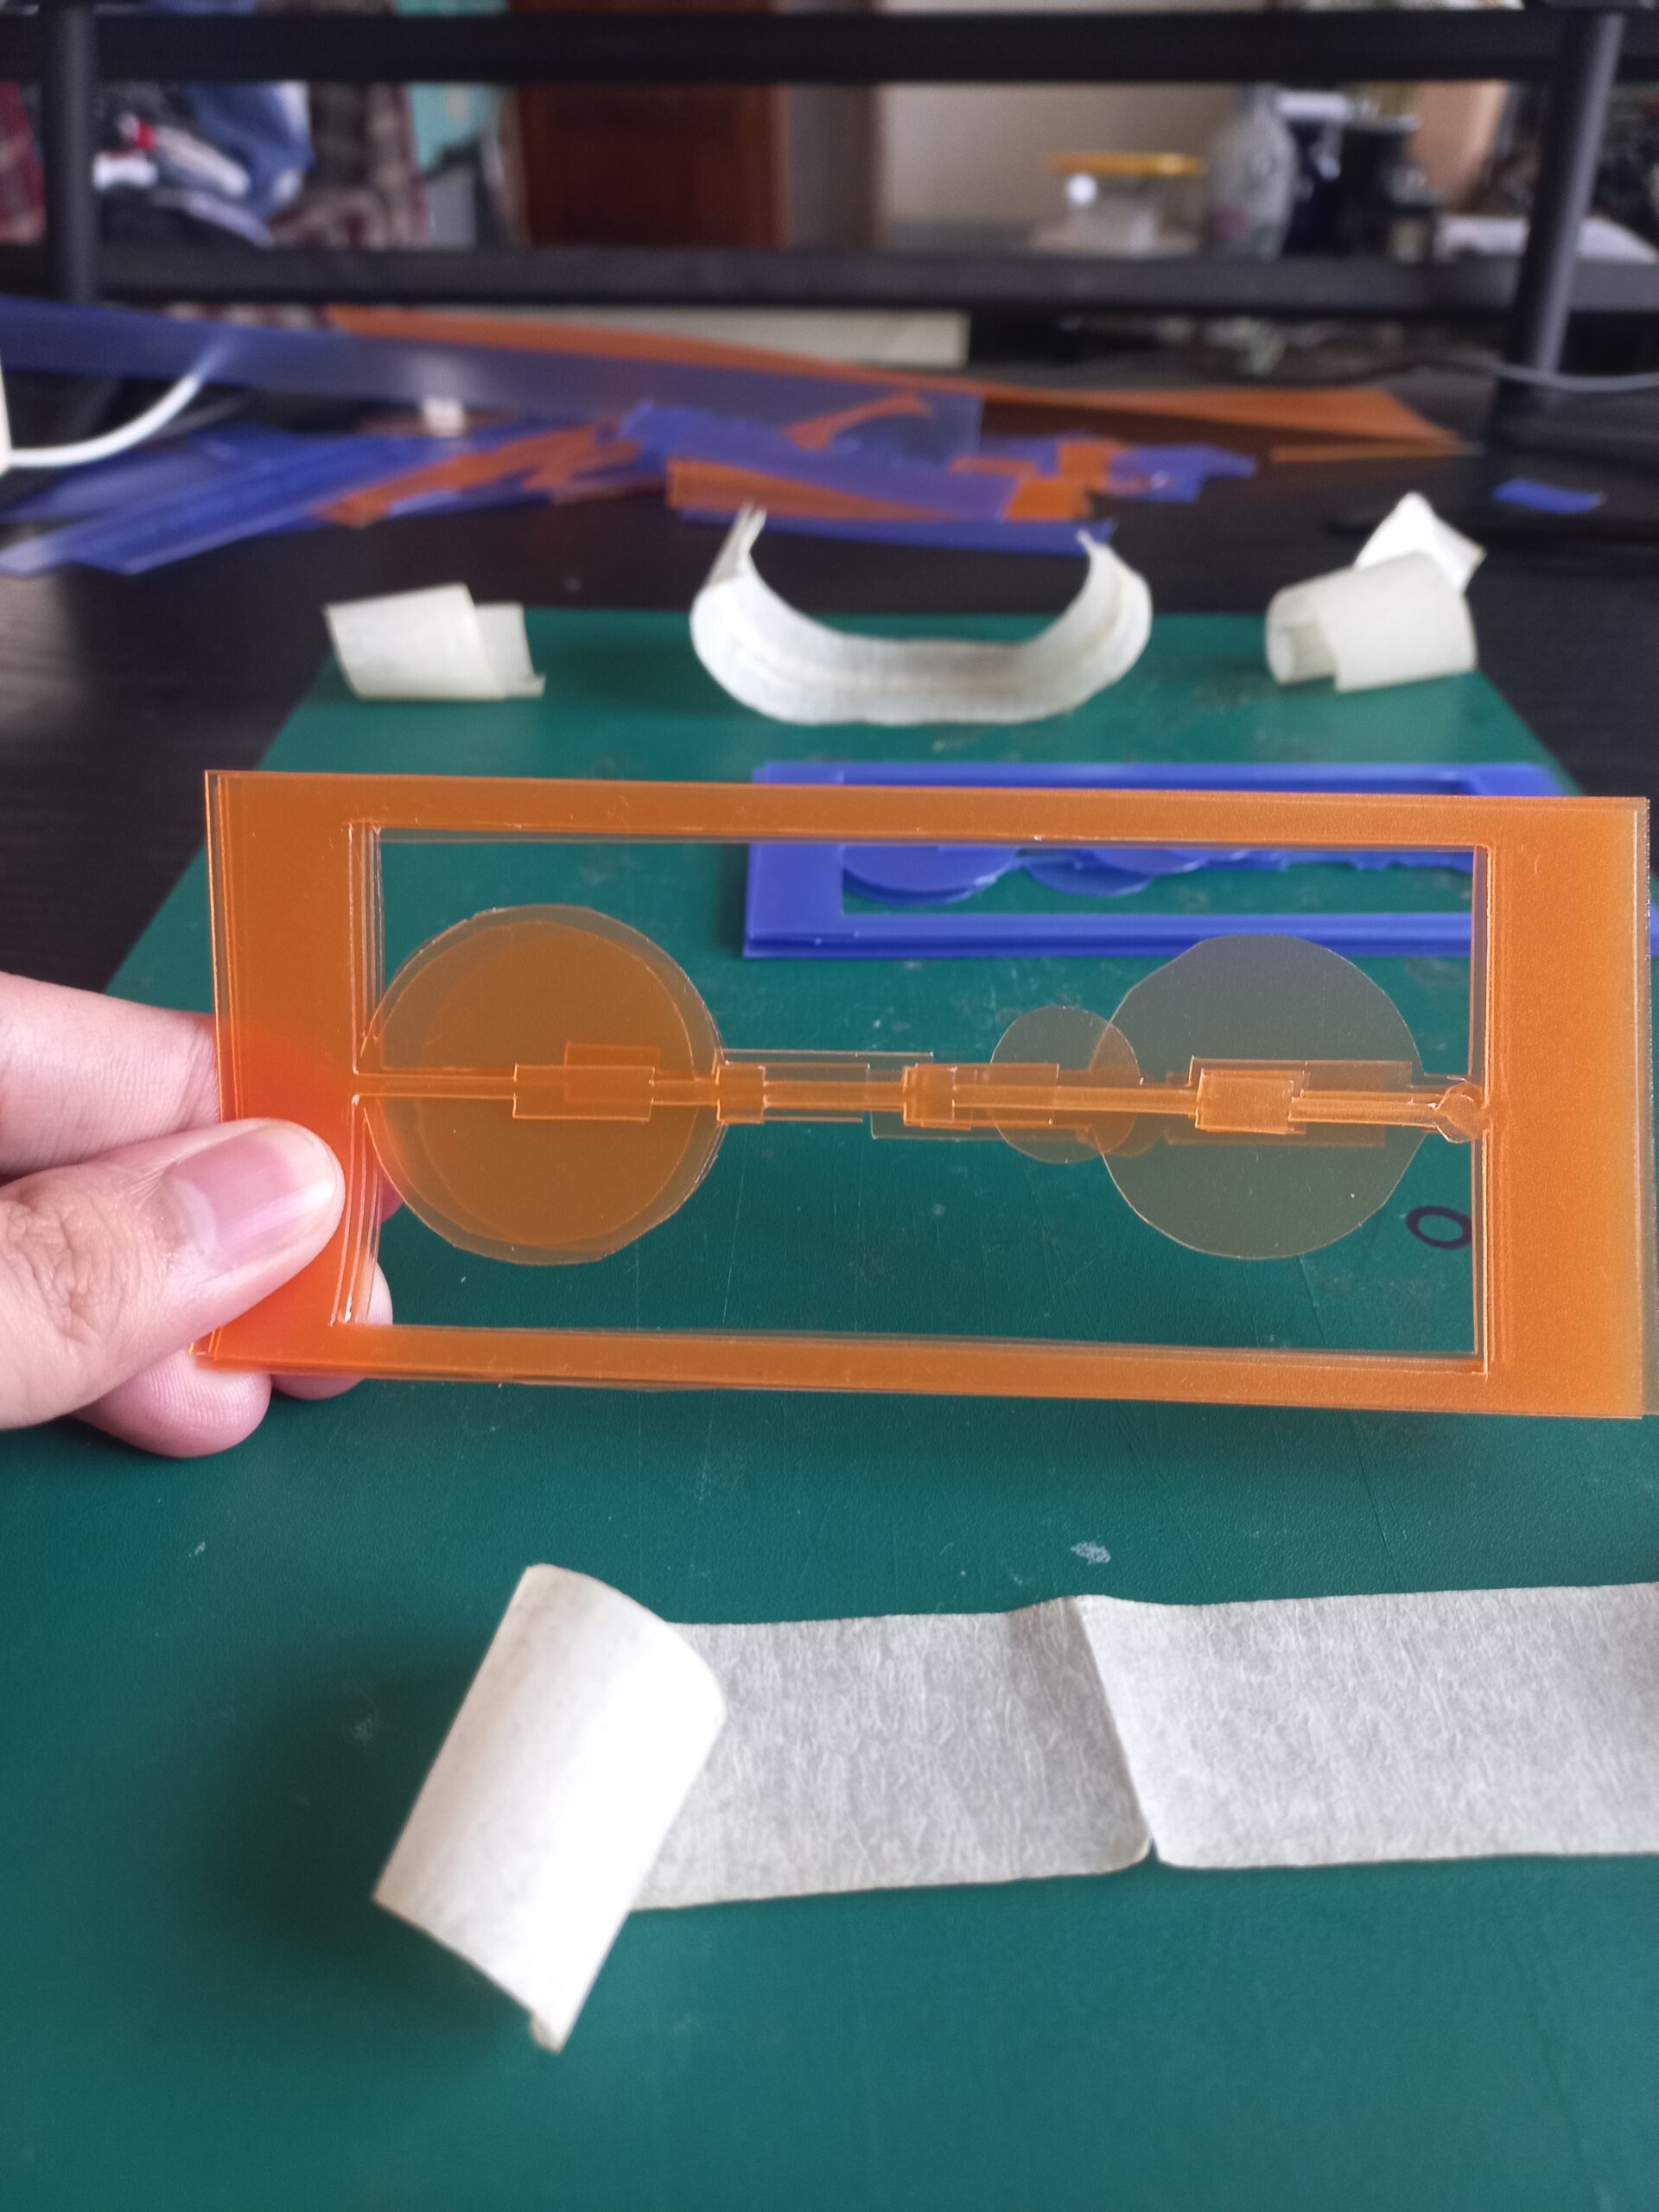
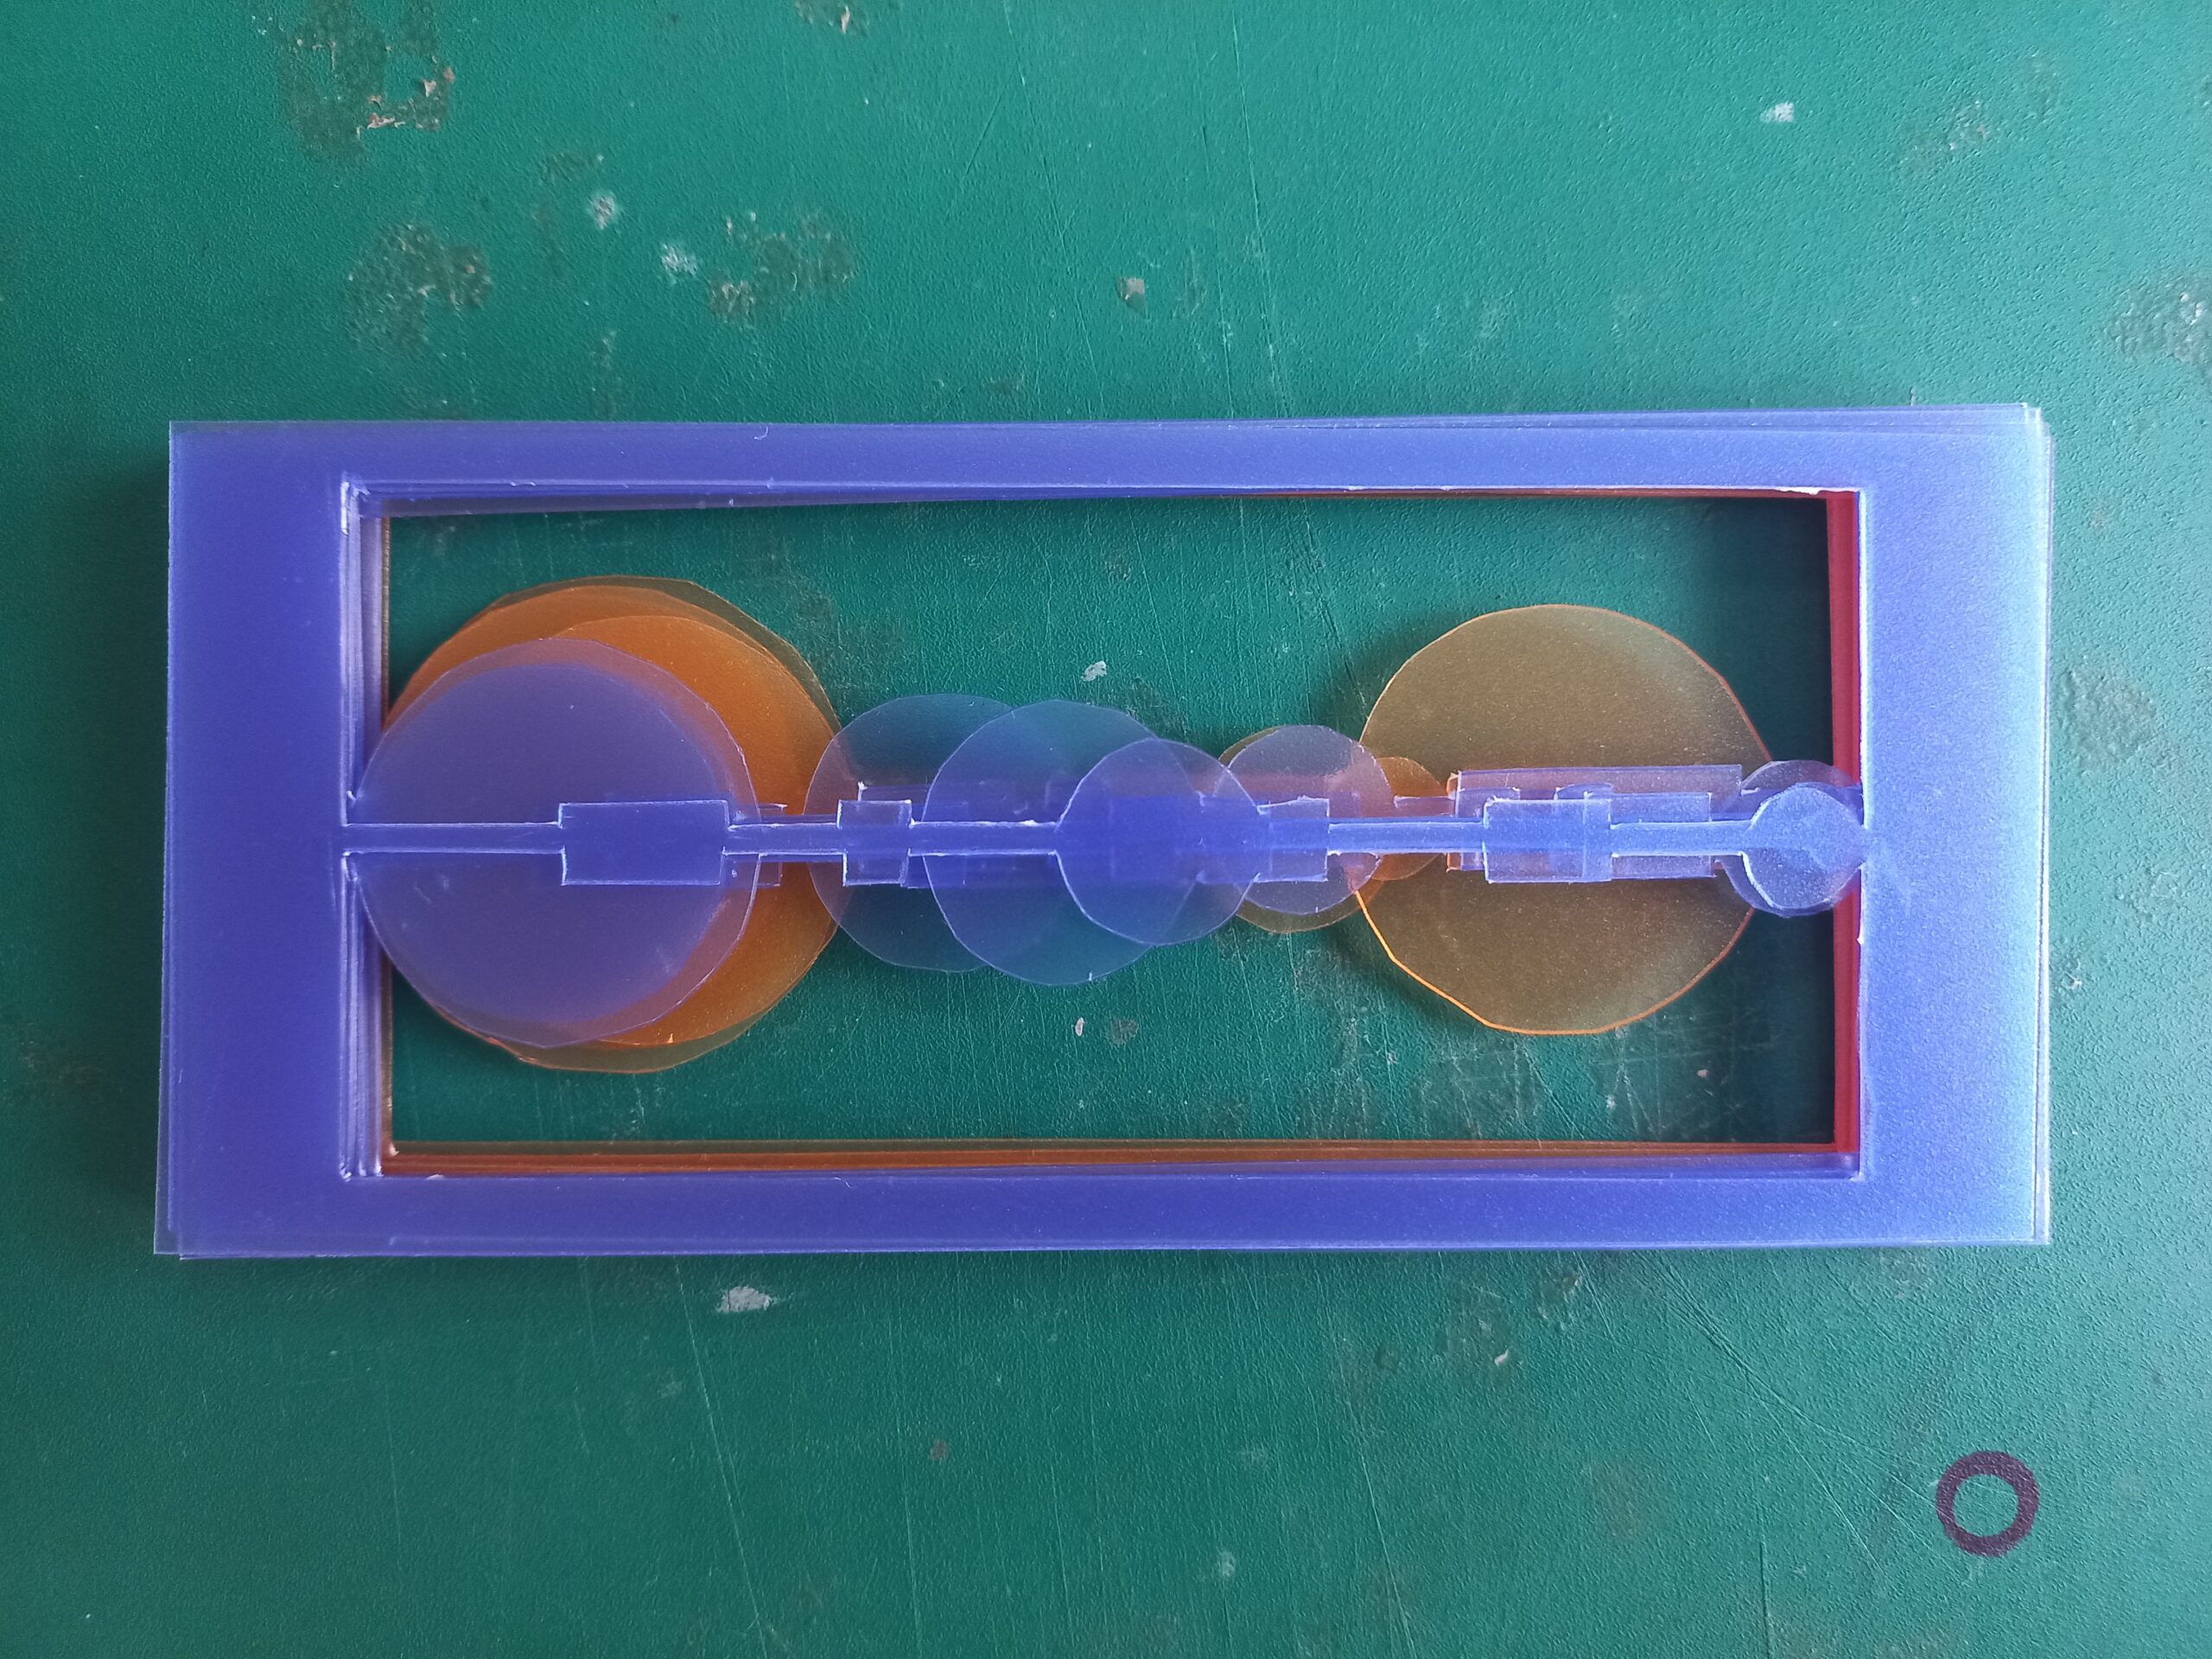
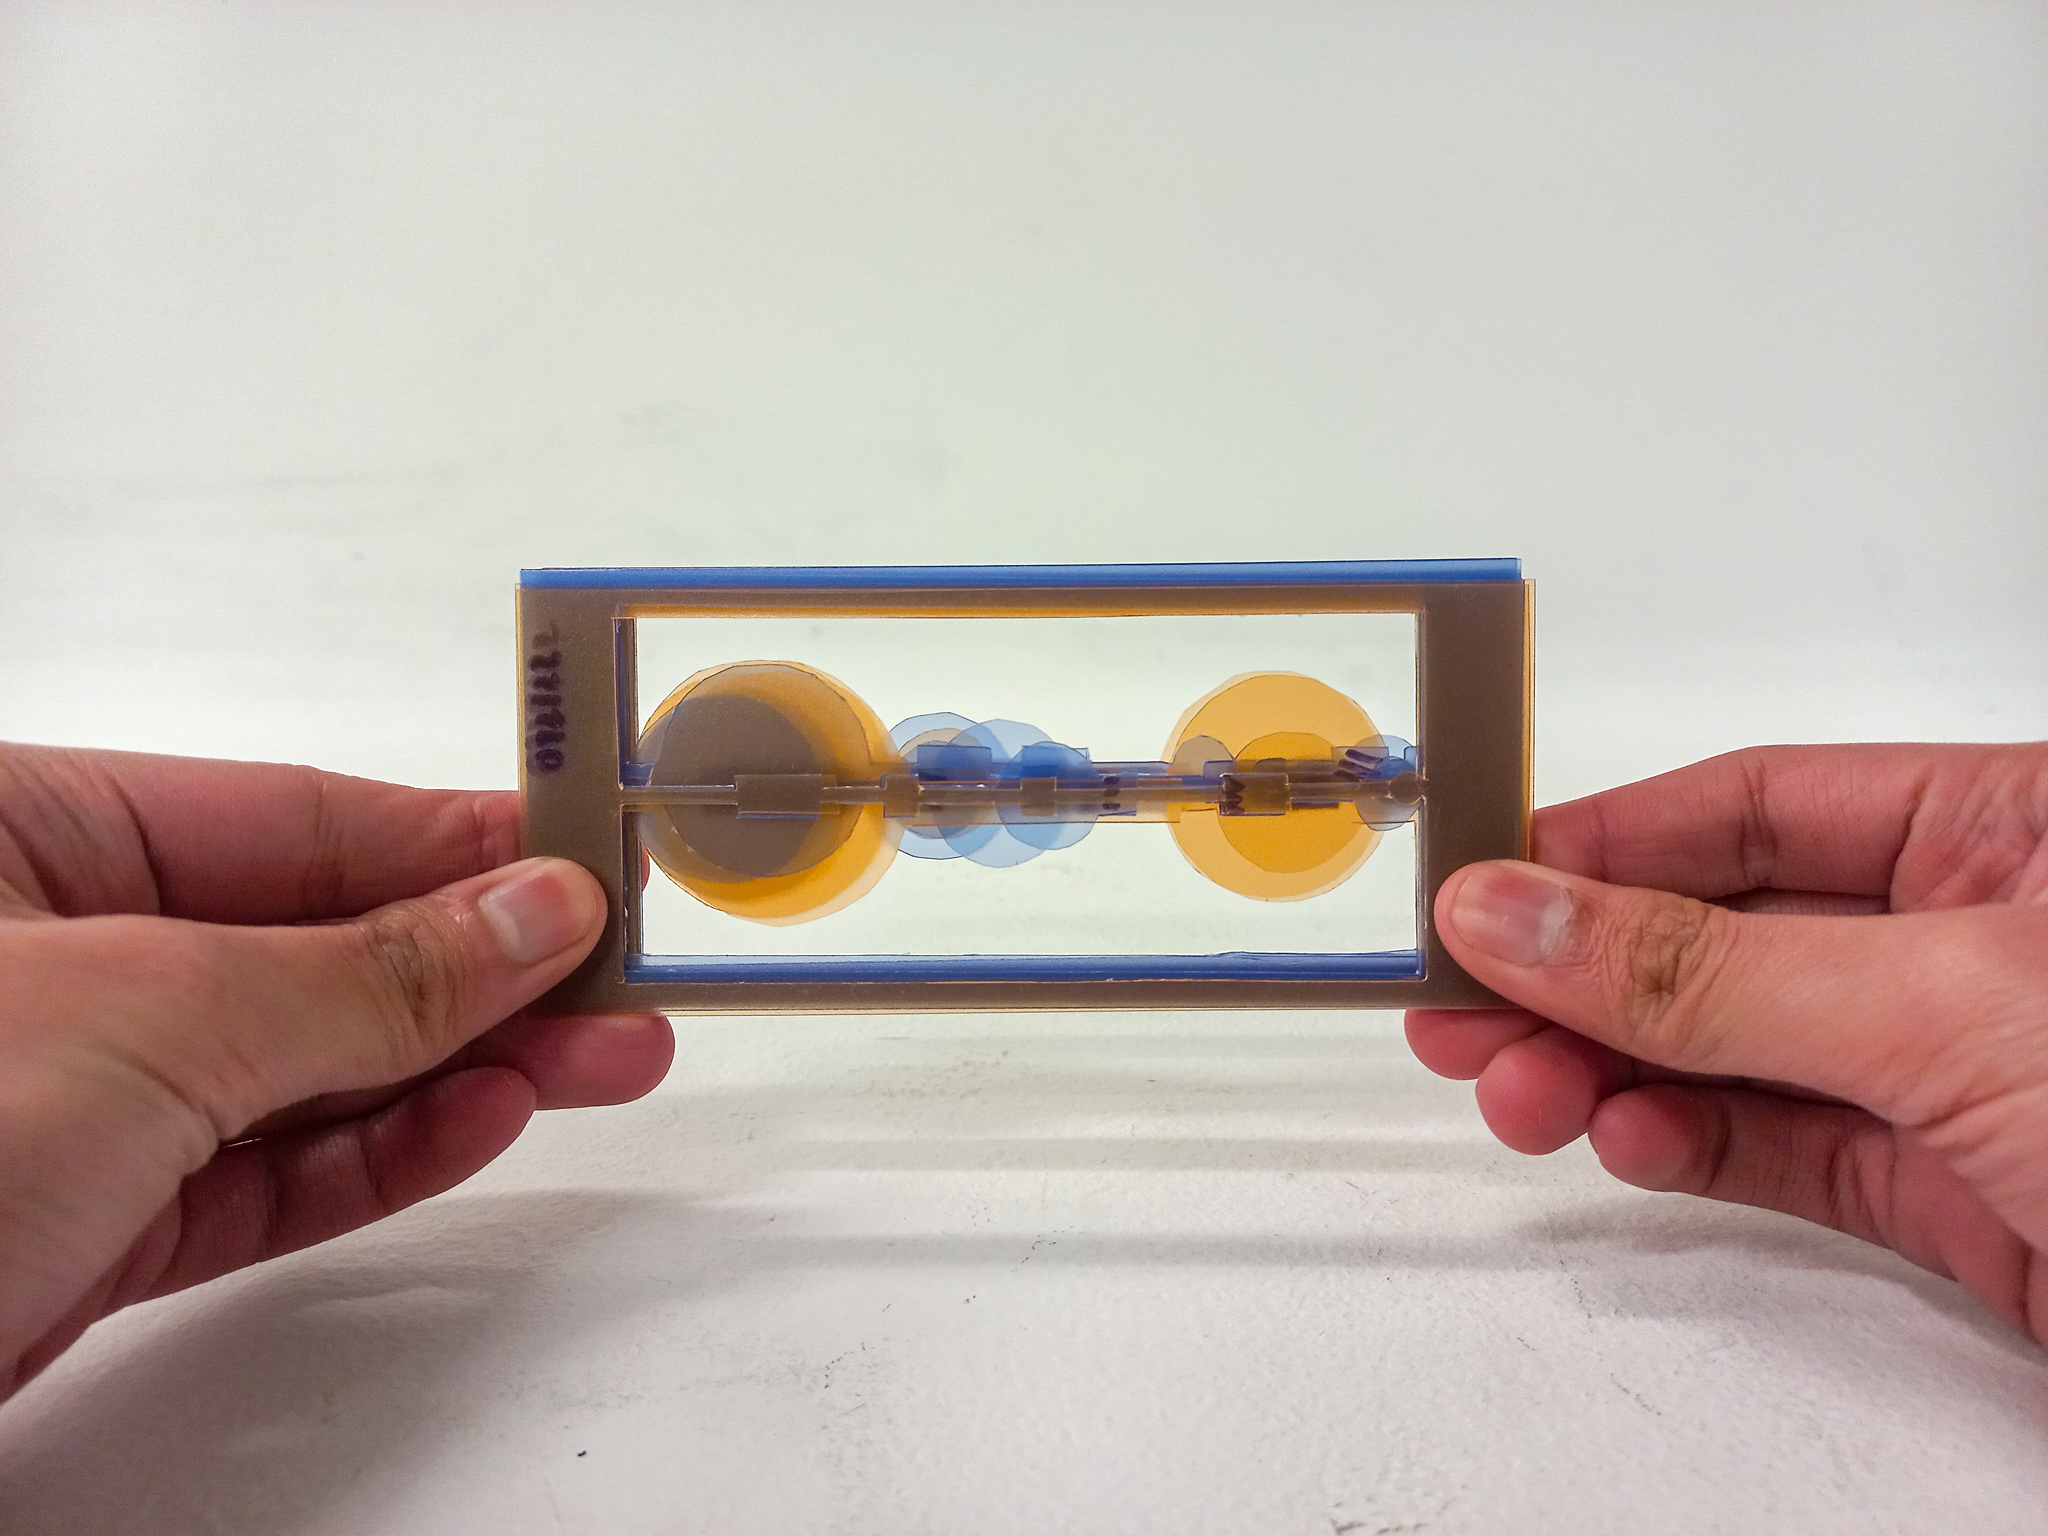
I wanted to make use of lights, shadows, and transparency in the communication of the data as a collection. Inspired by forms and diffusions of light, I played around with the ideas of reimagining visualizing time in layers. This resulted in different approaches making use of transparent paper, cutouts, shadow depth, and stackability.
Final Design
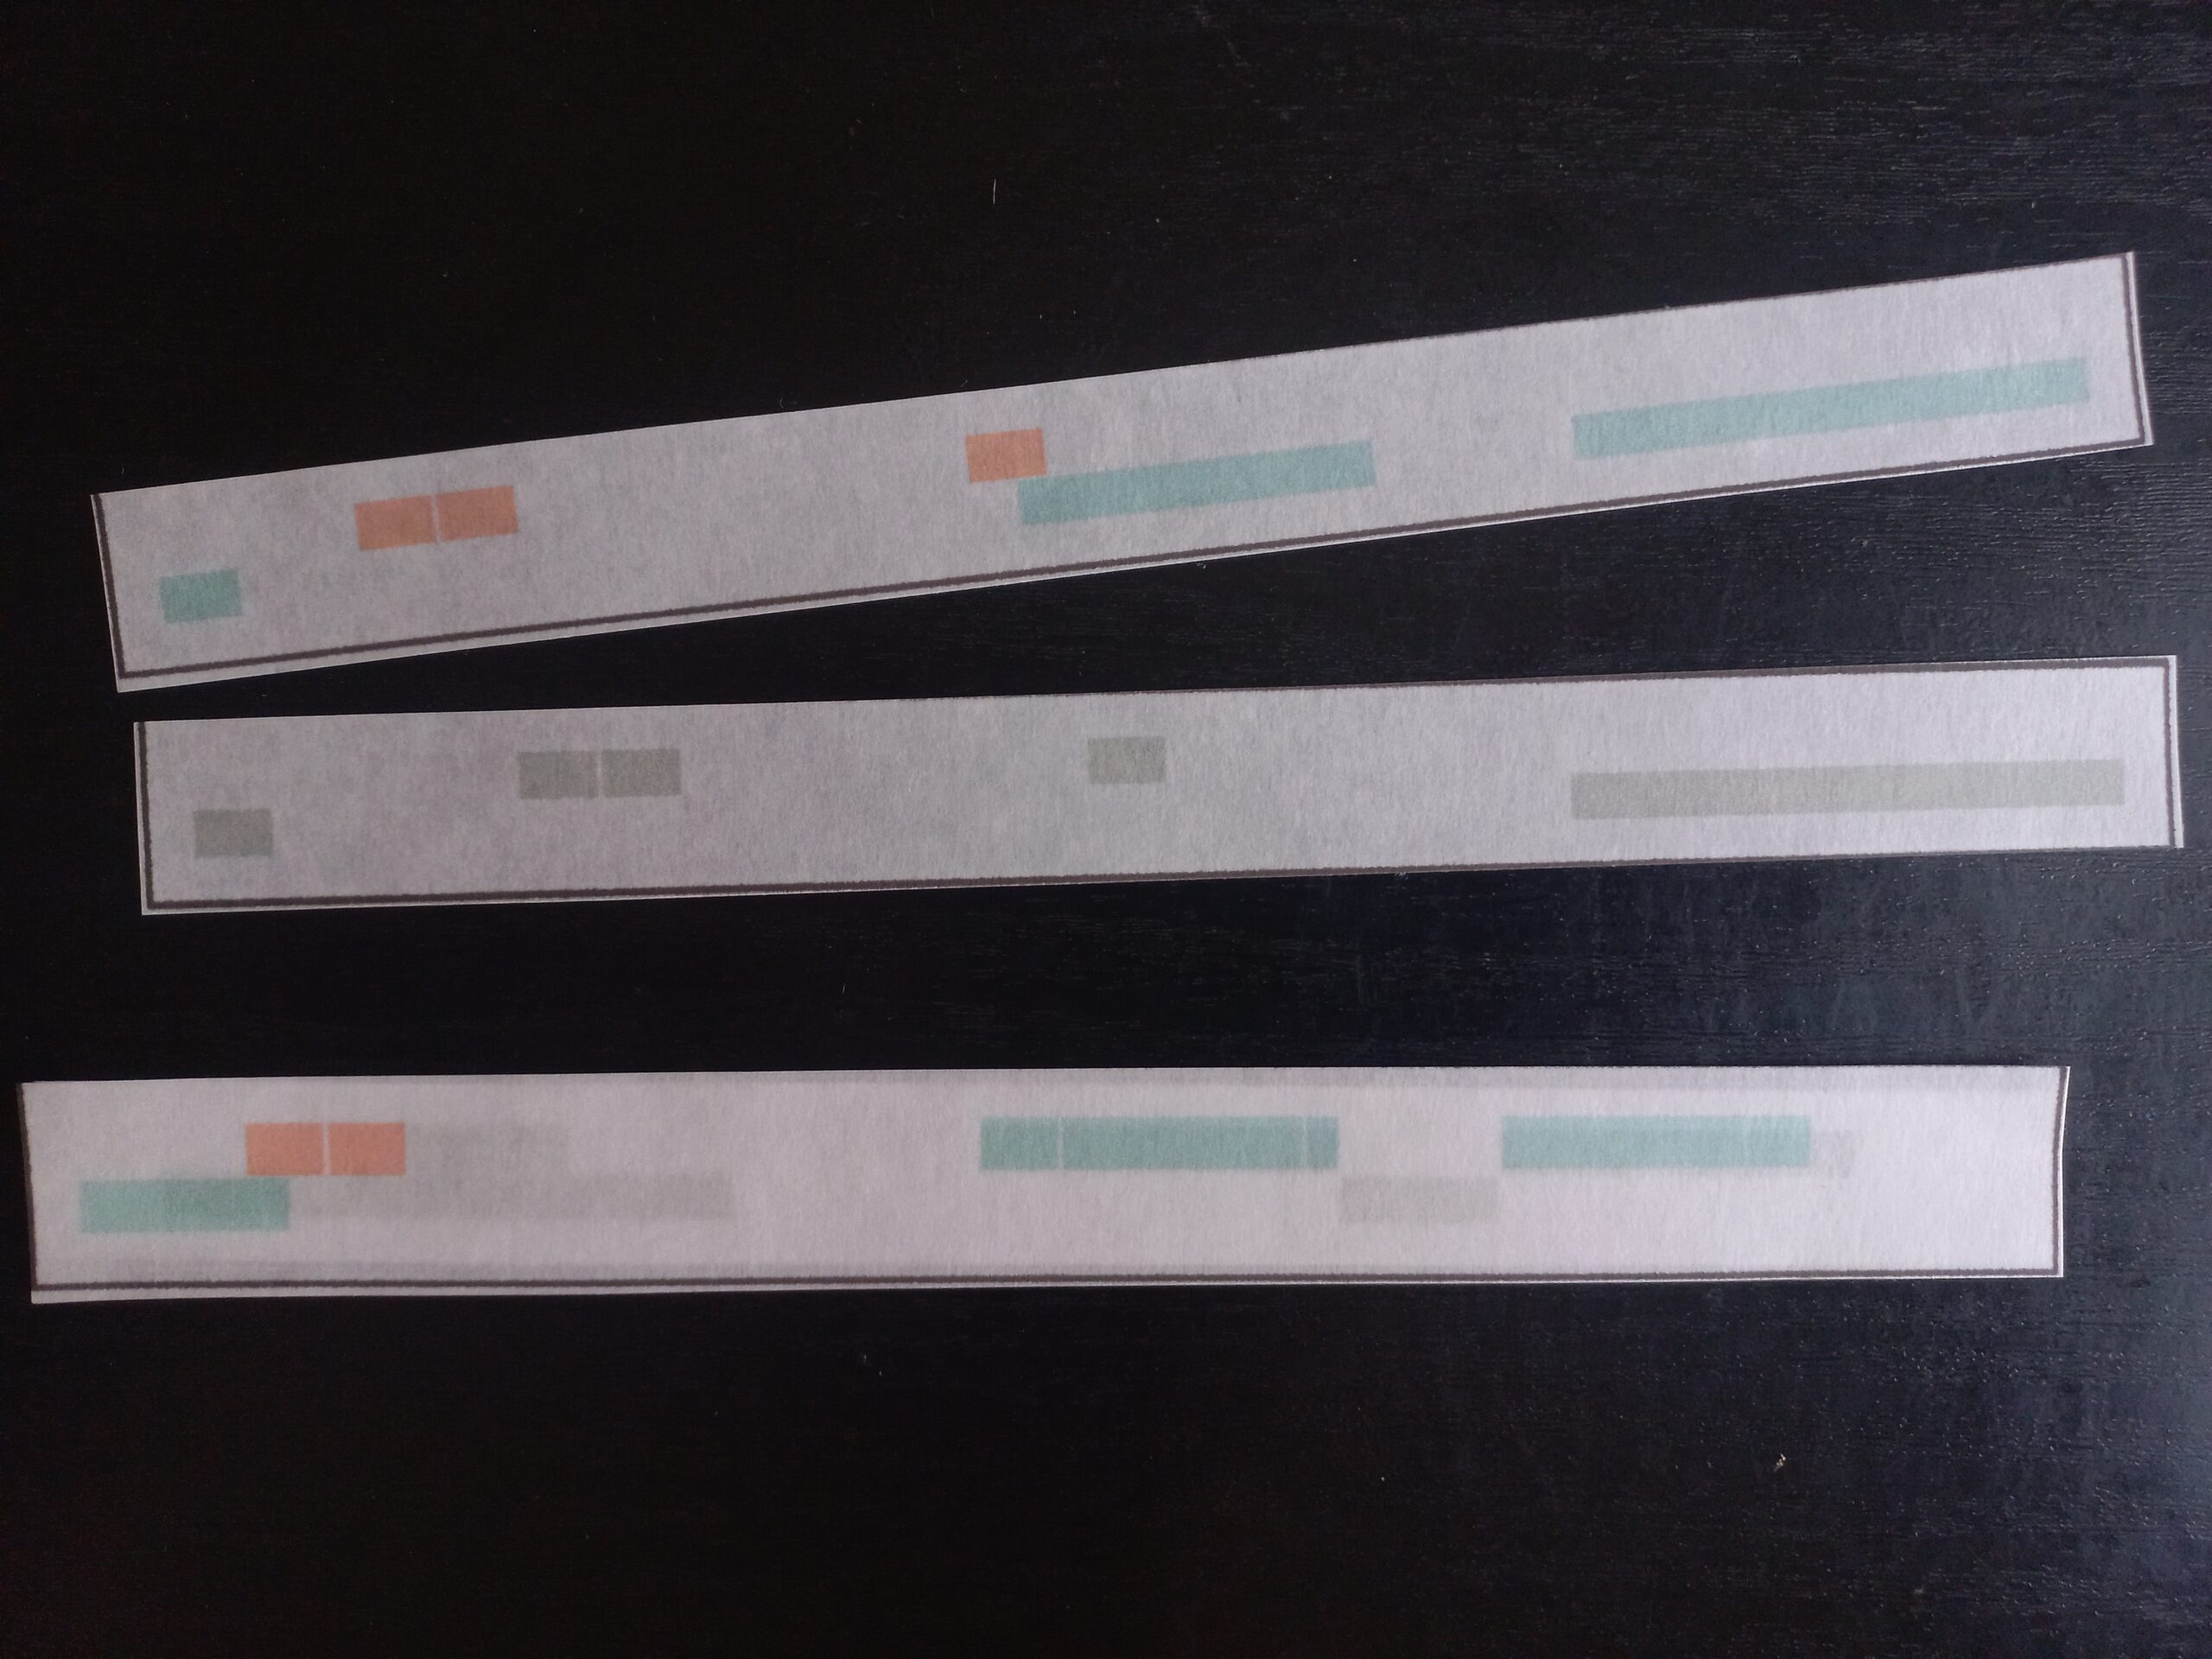
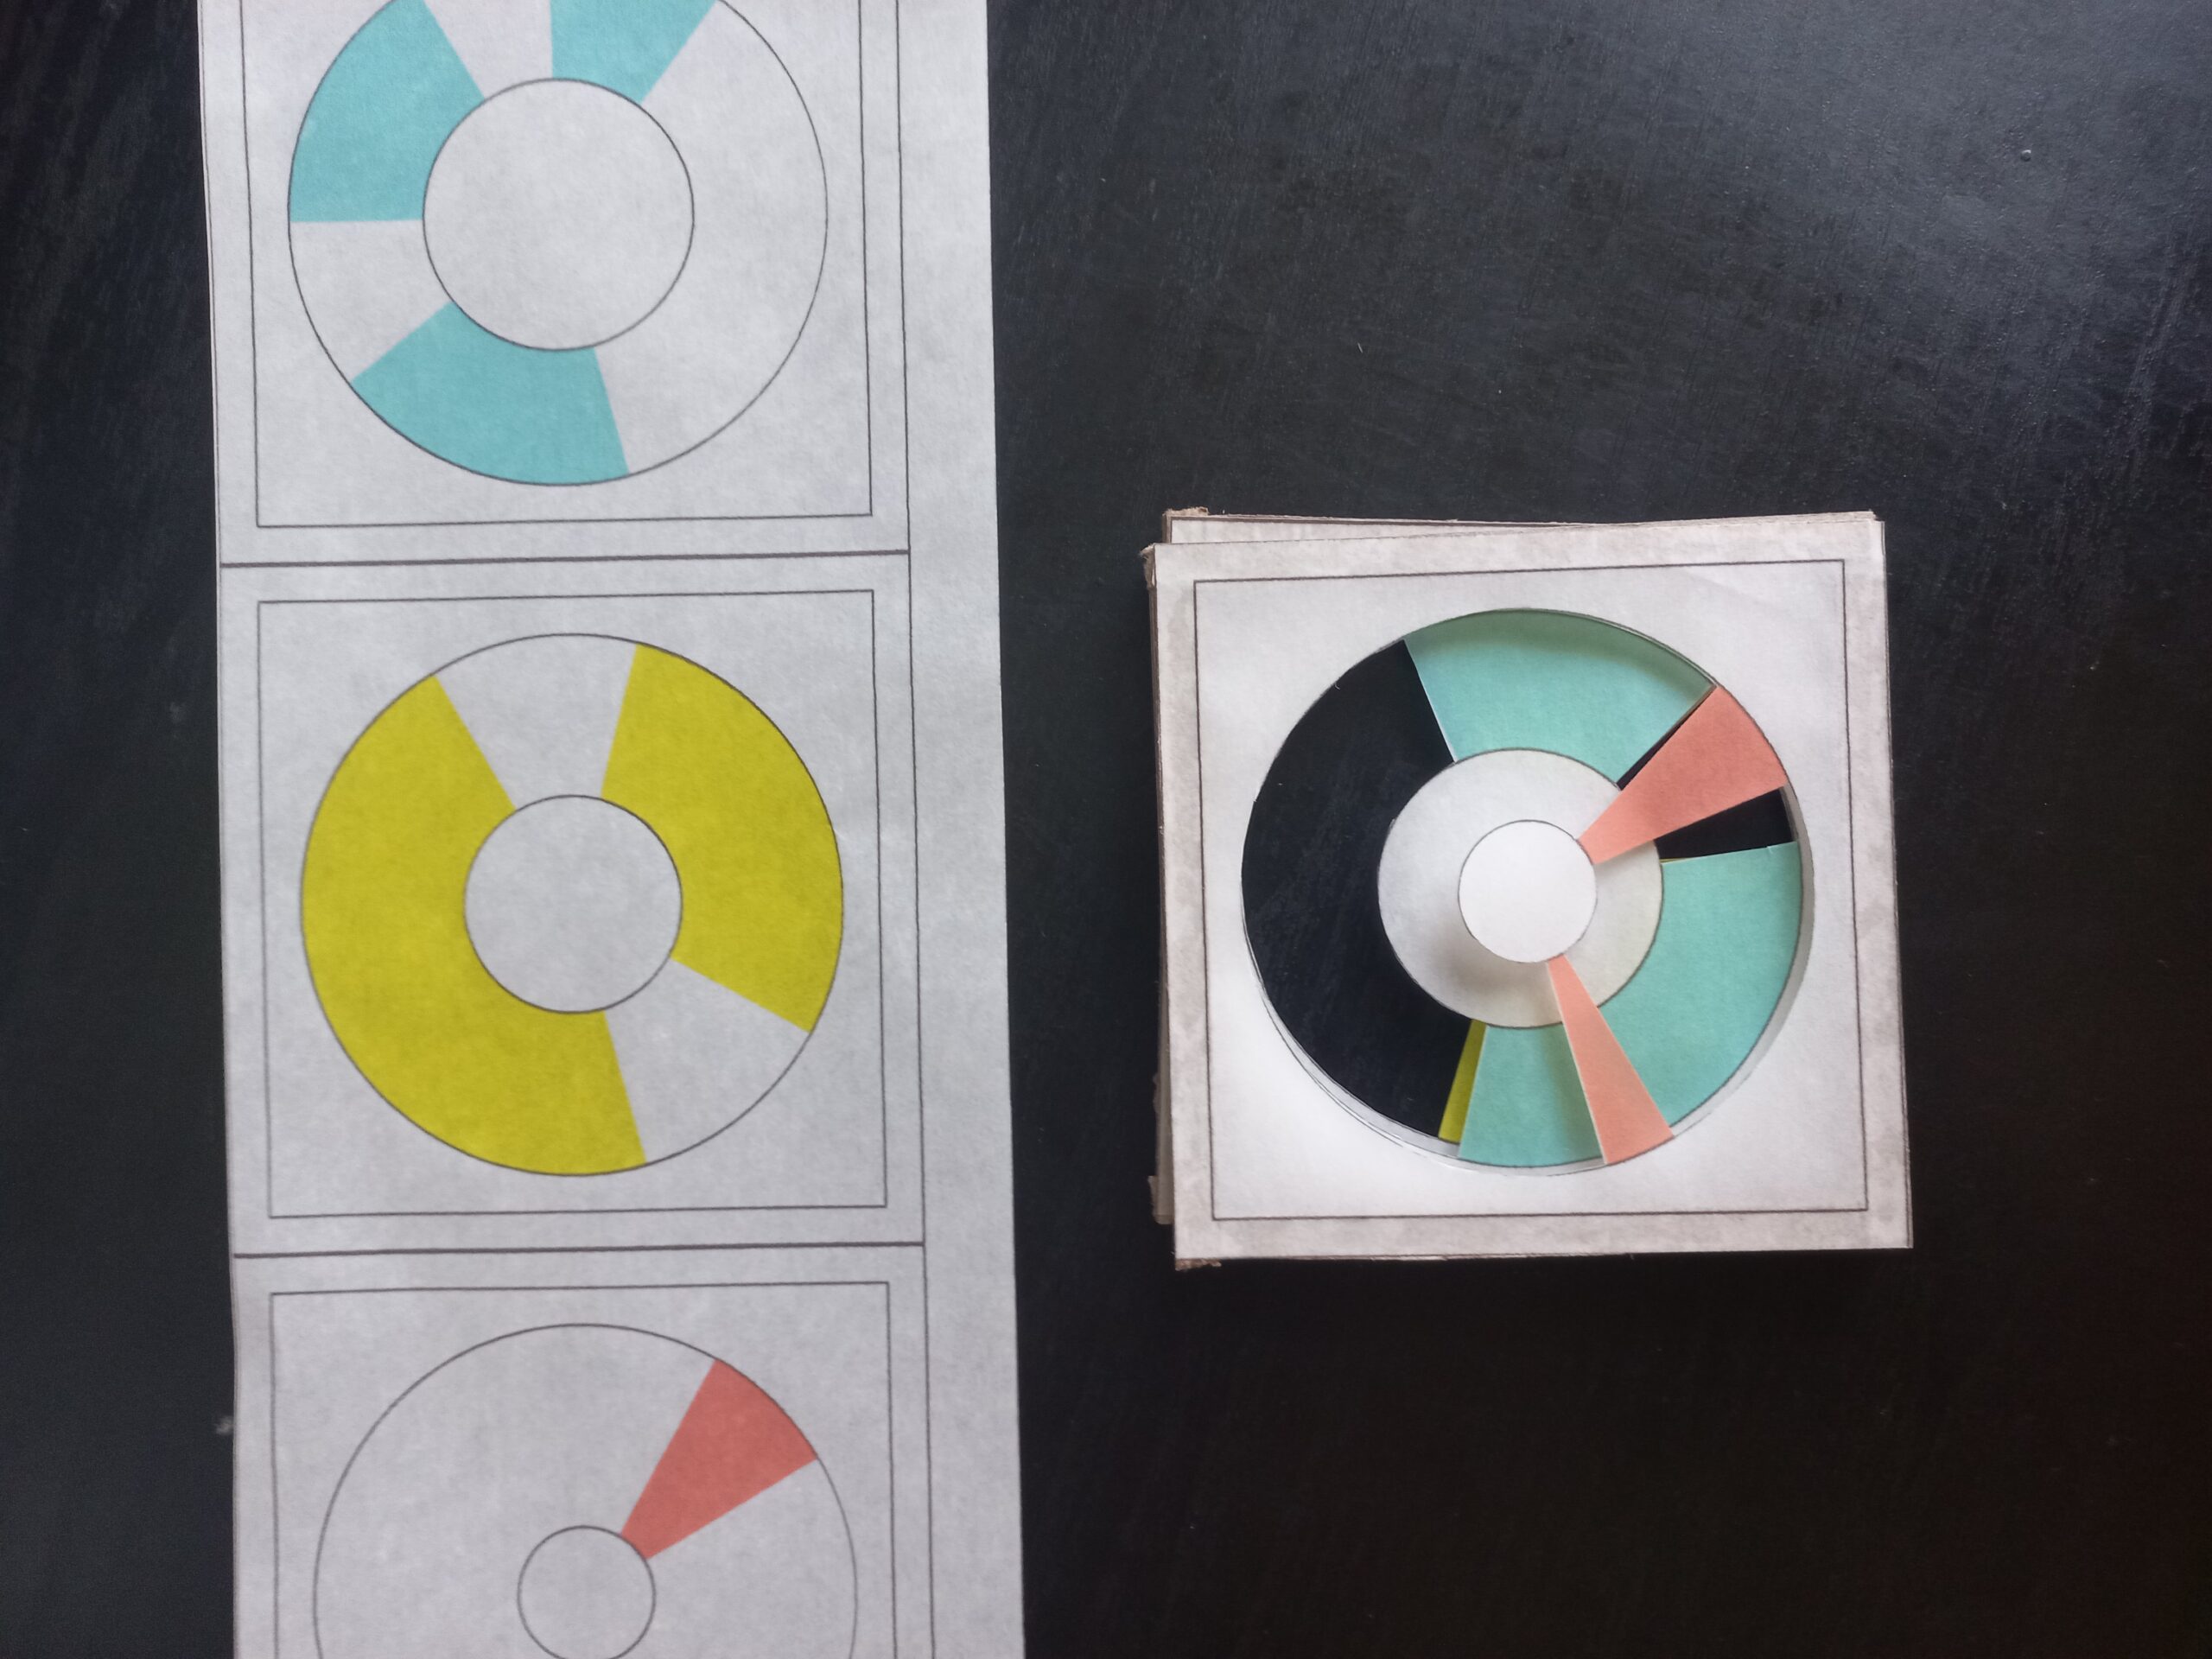
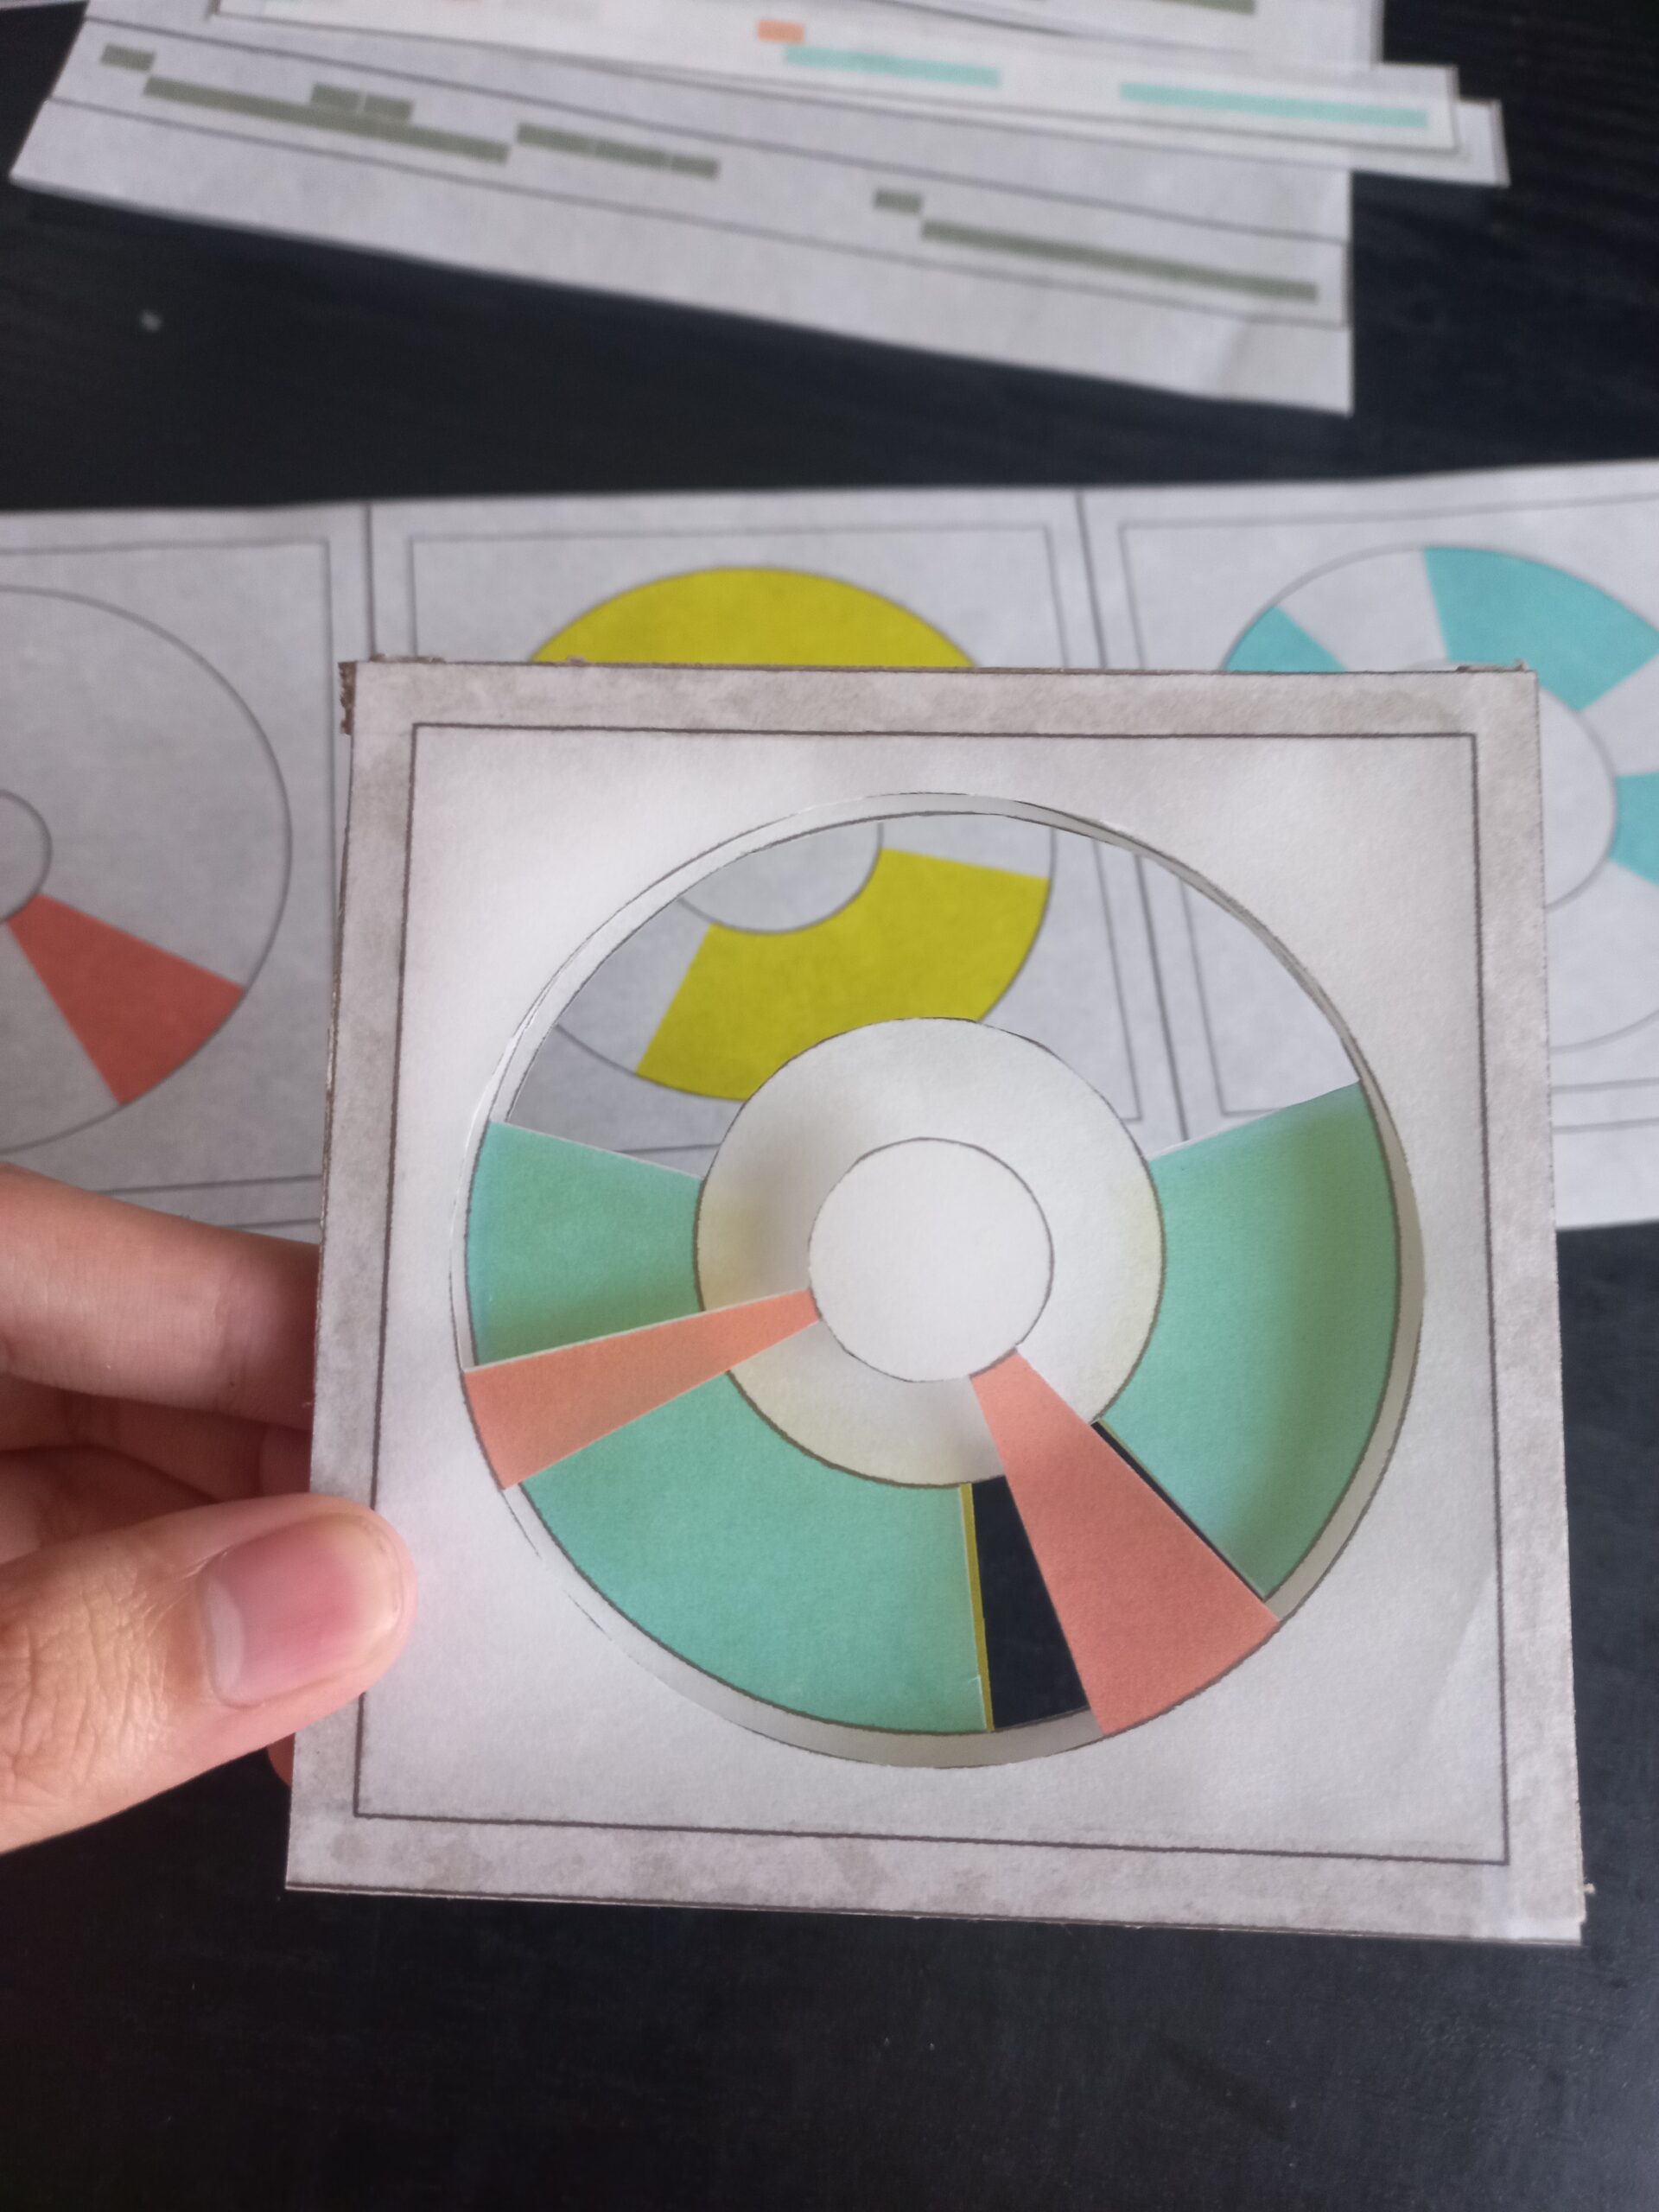
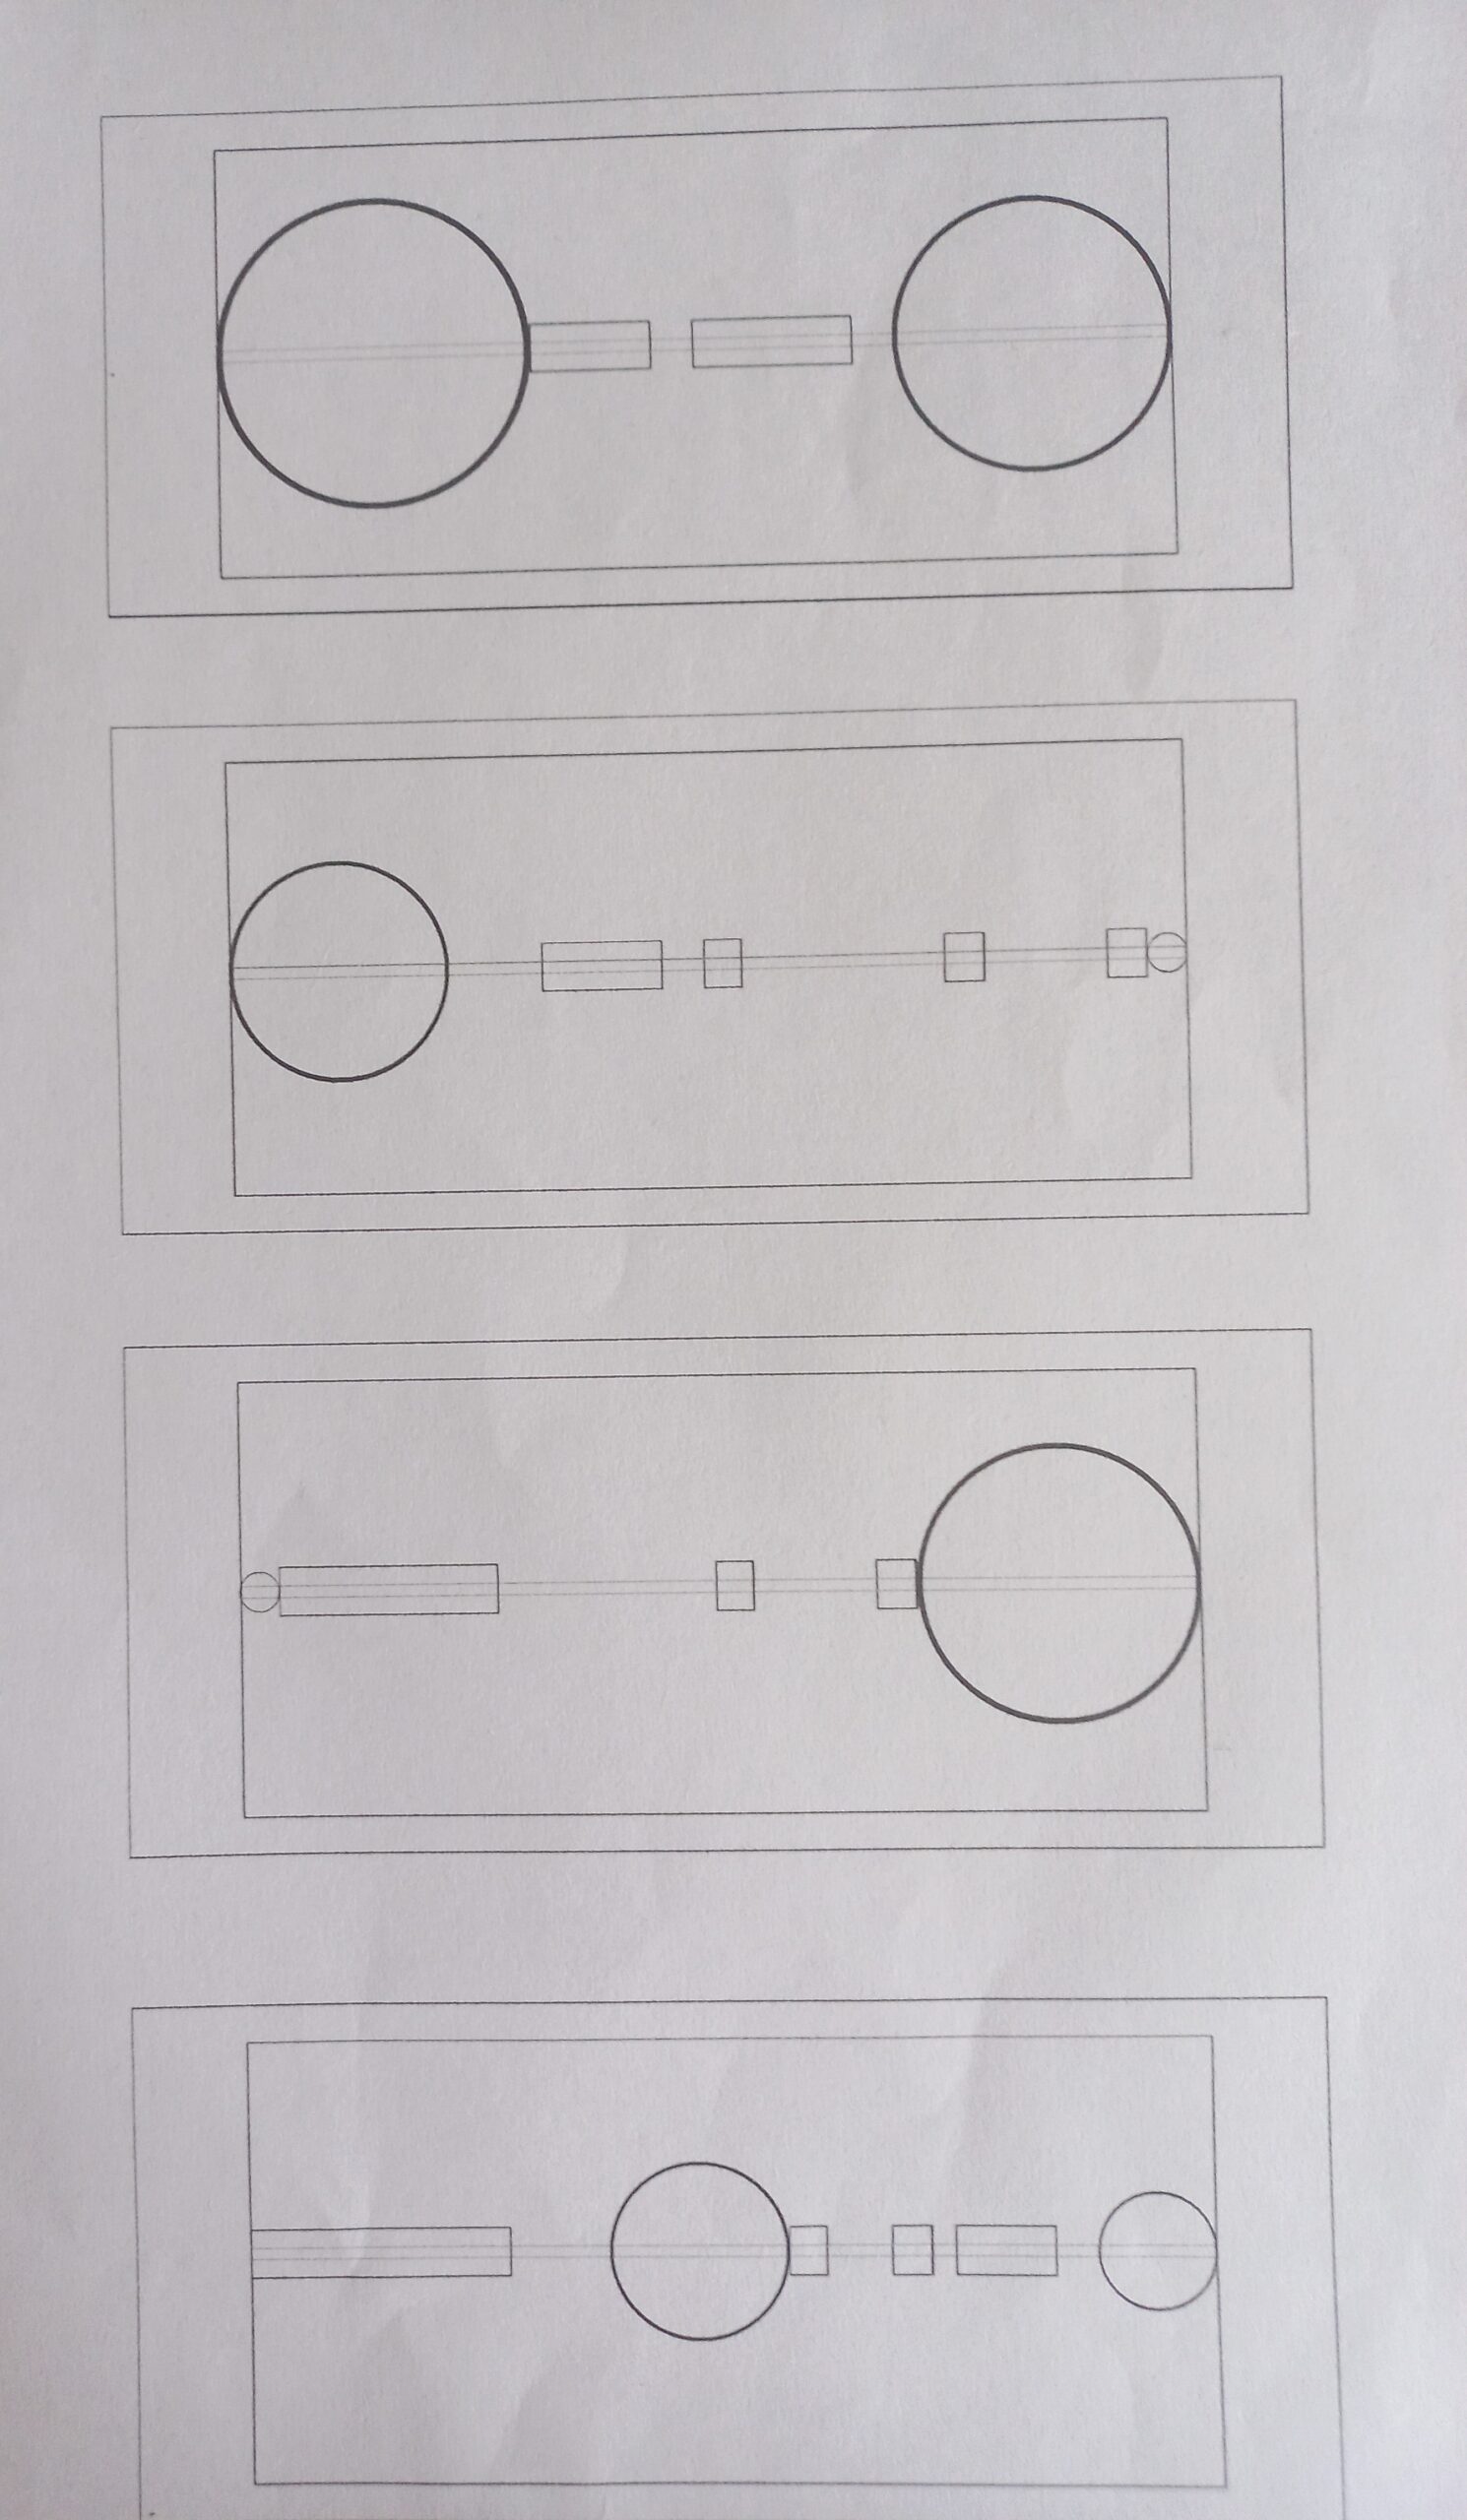
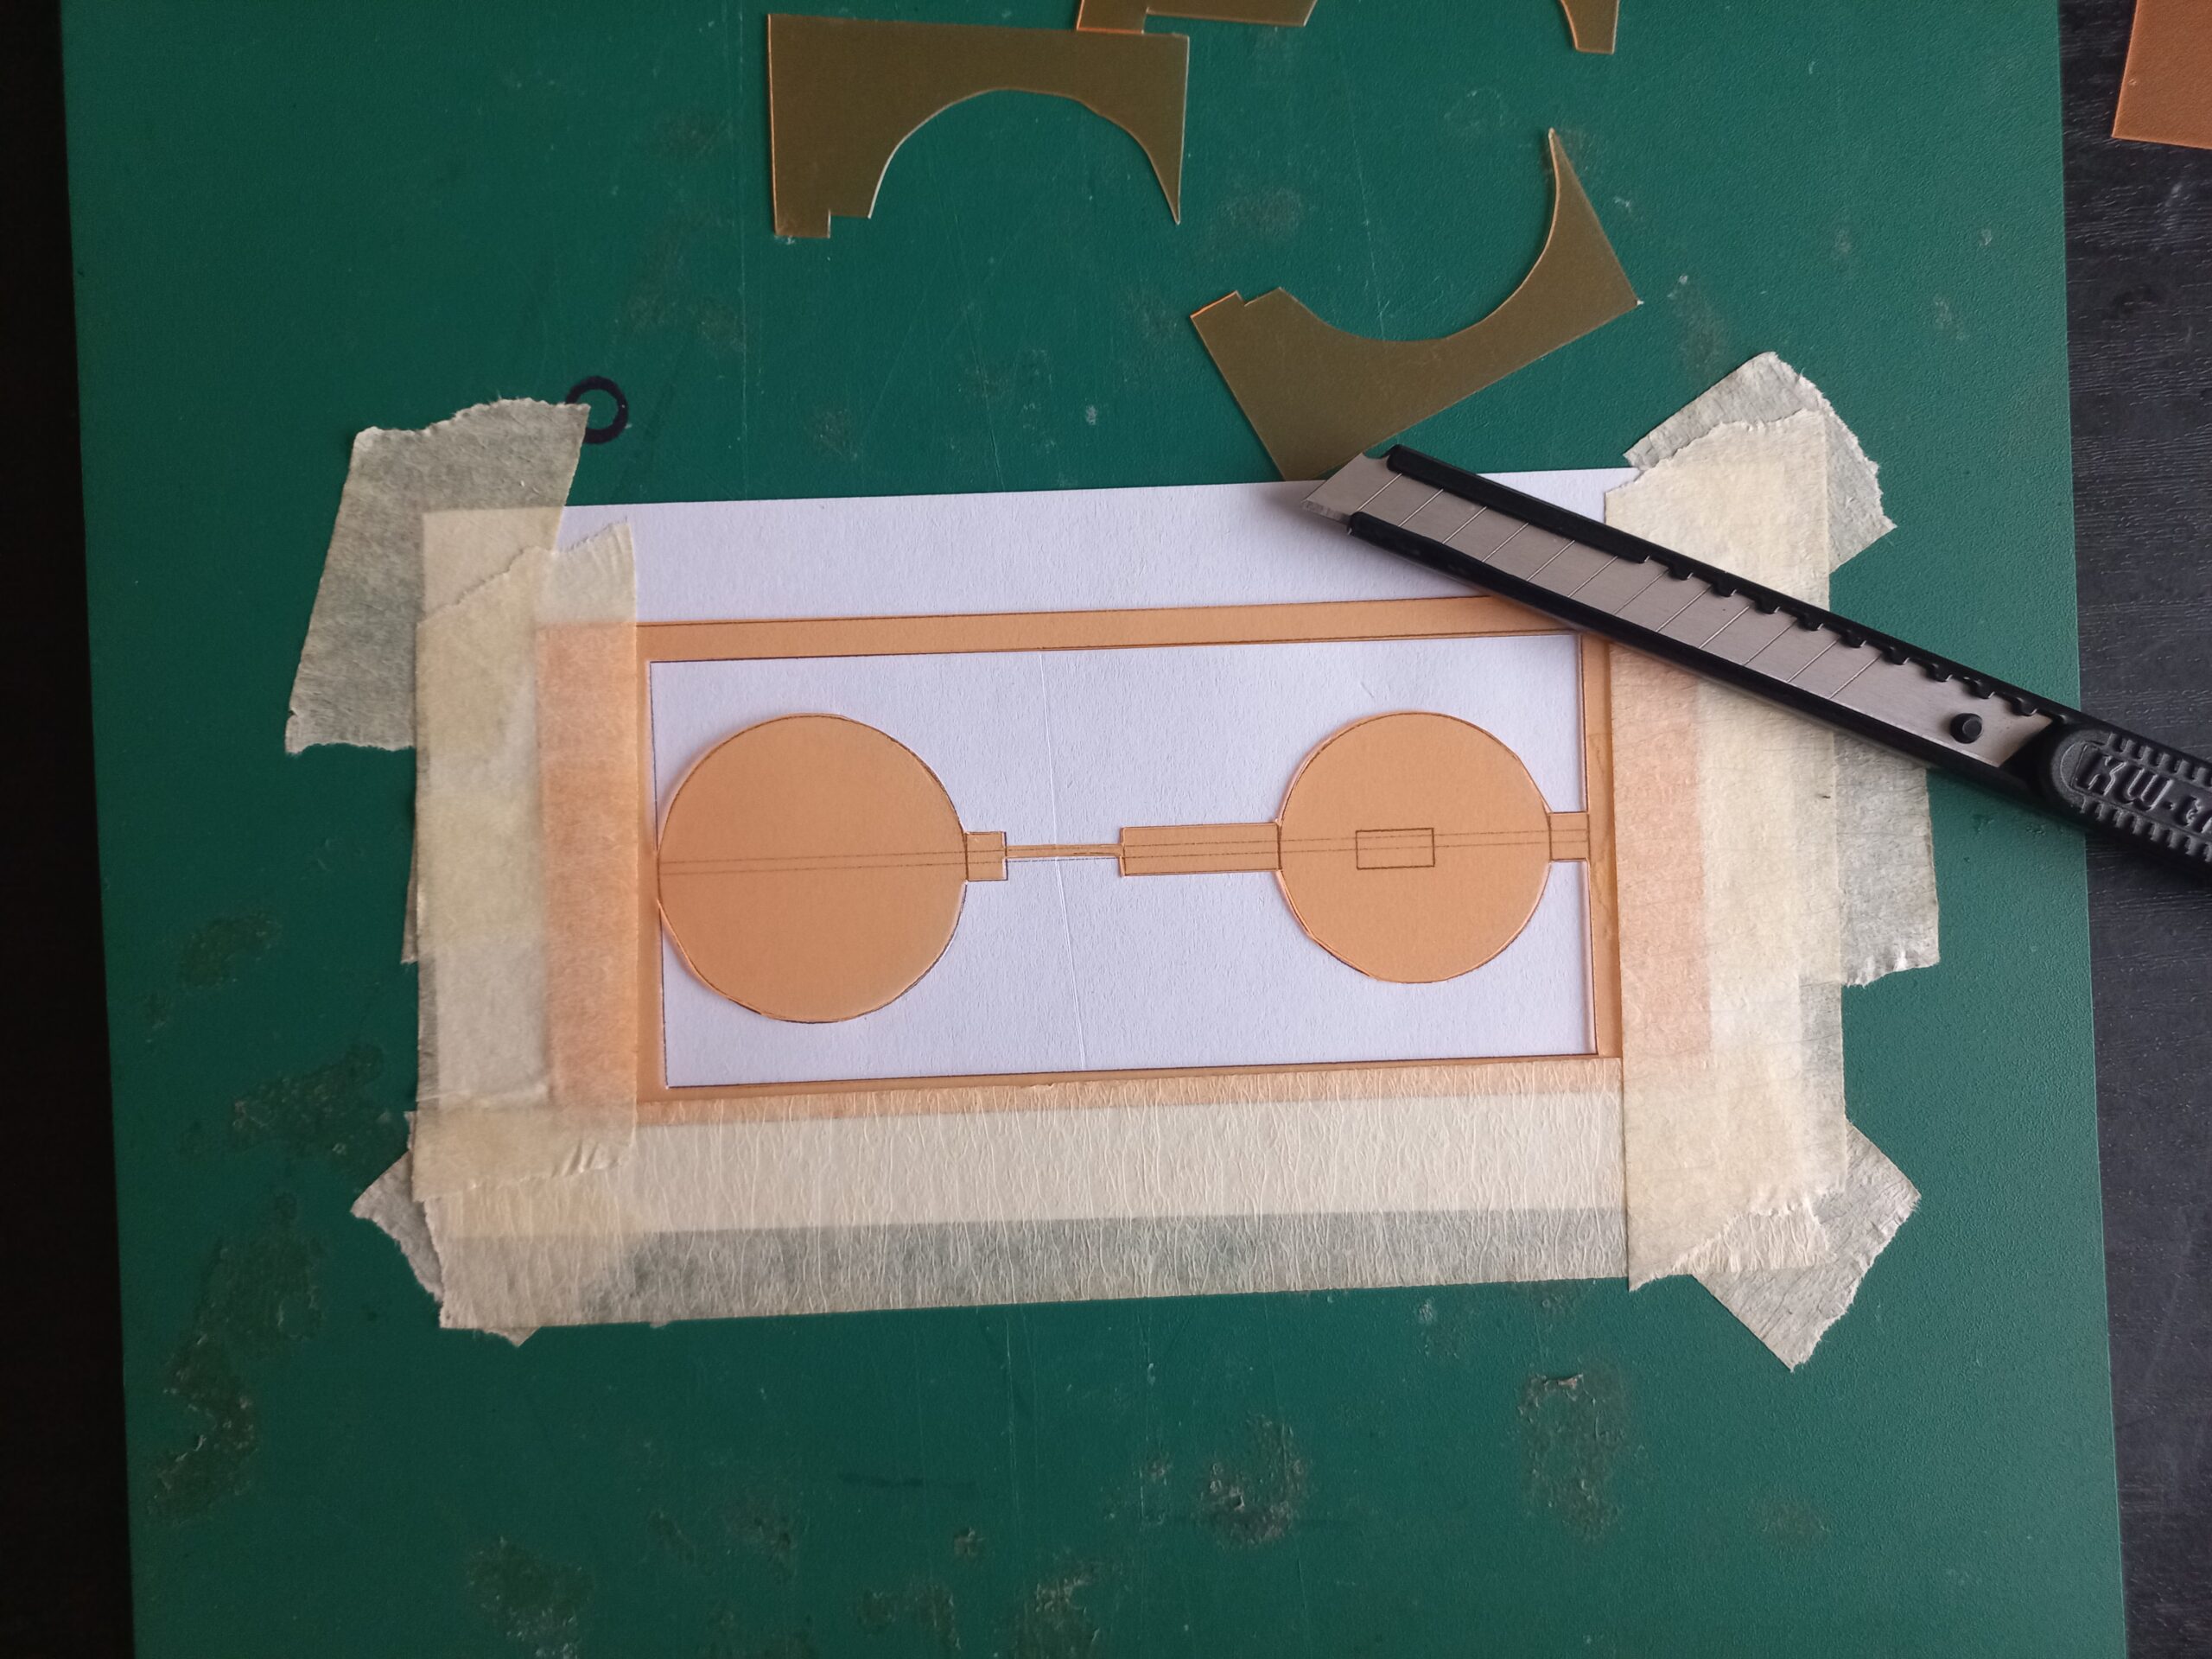
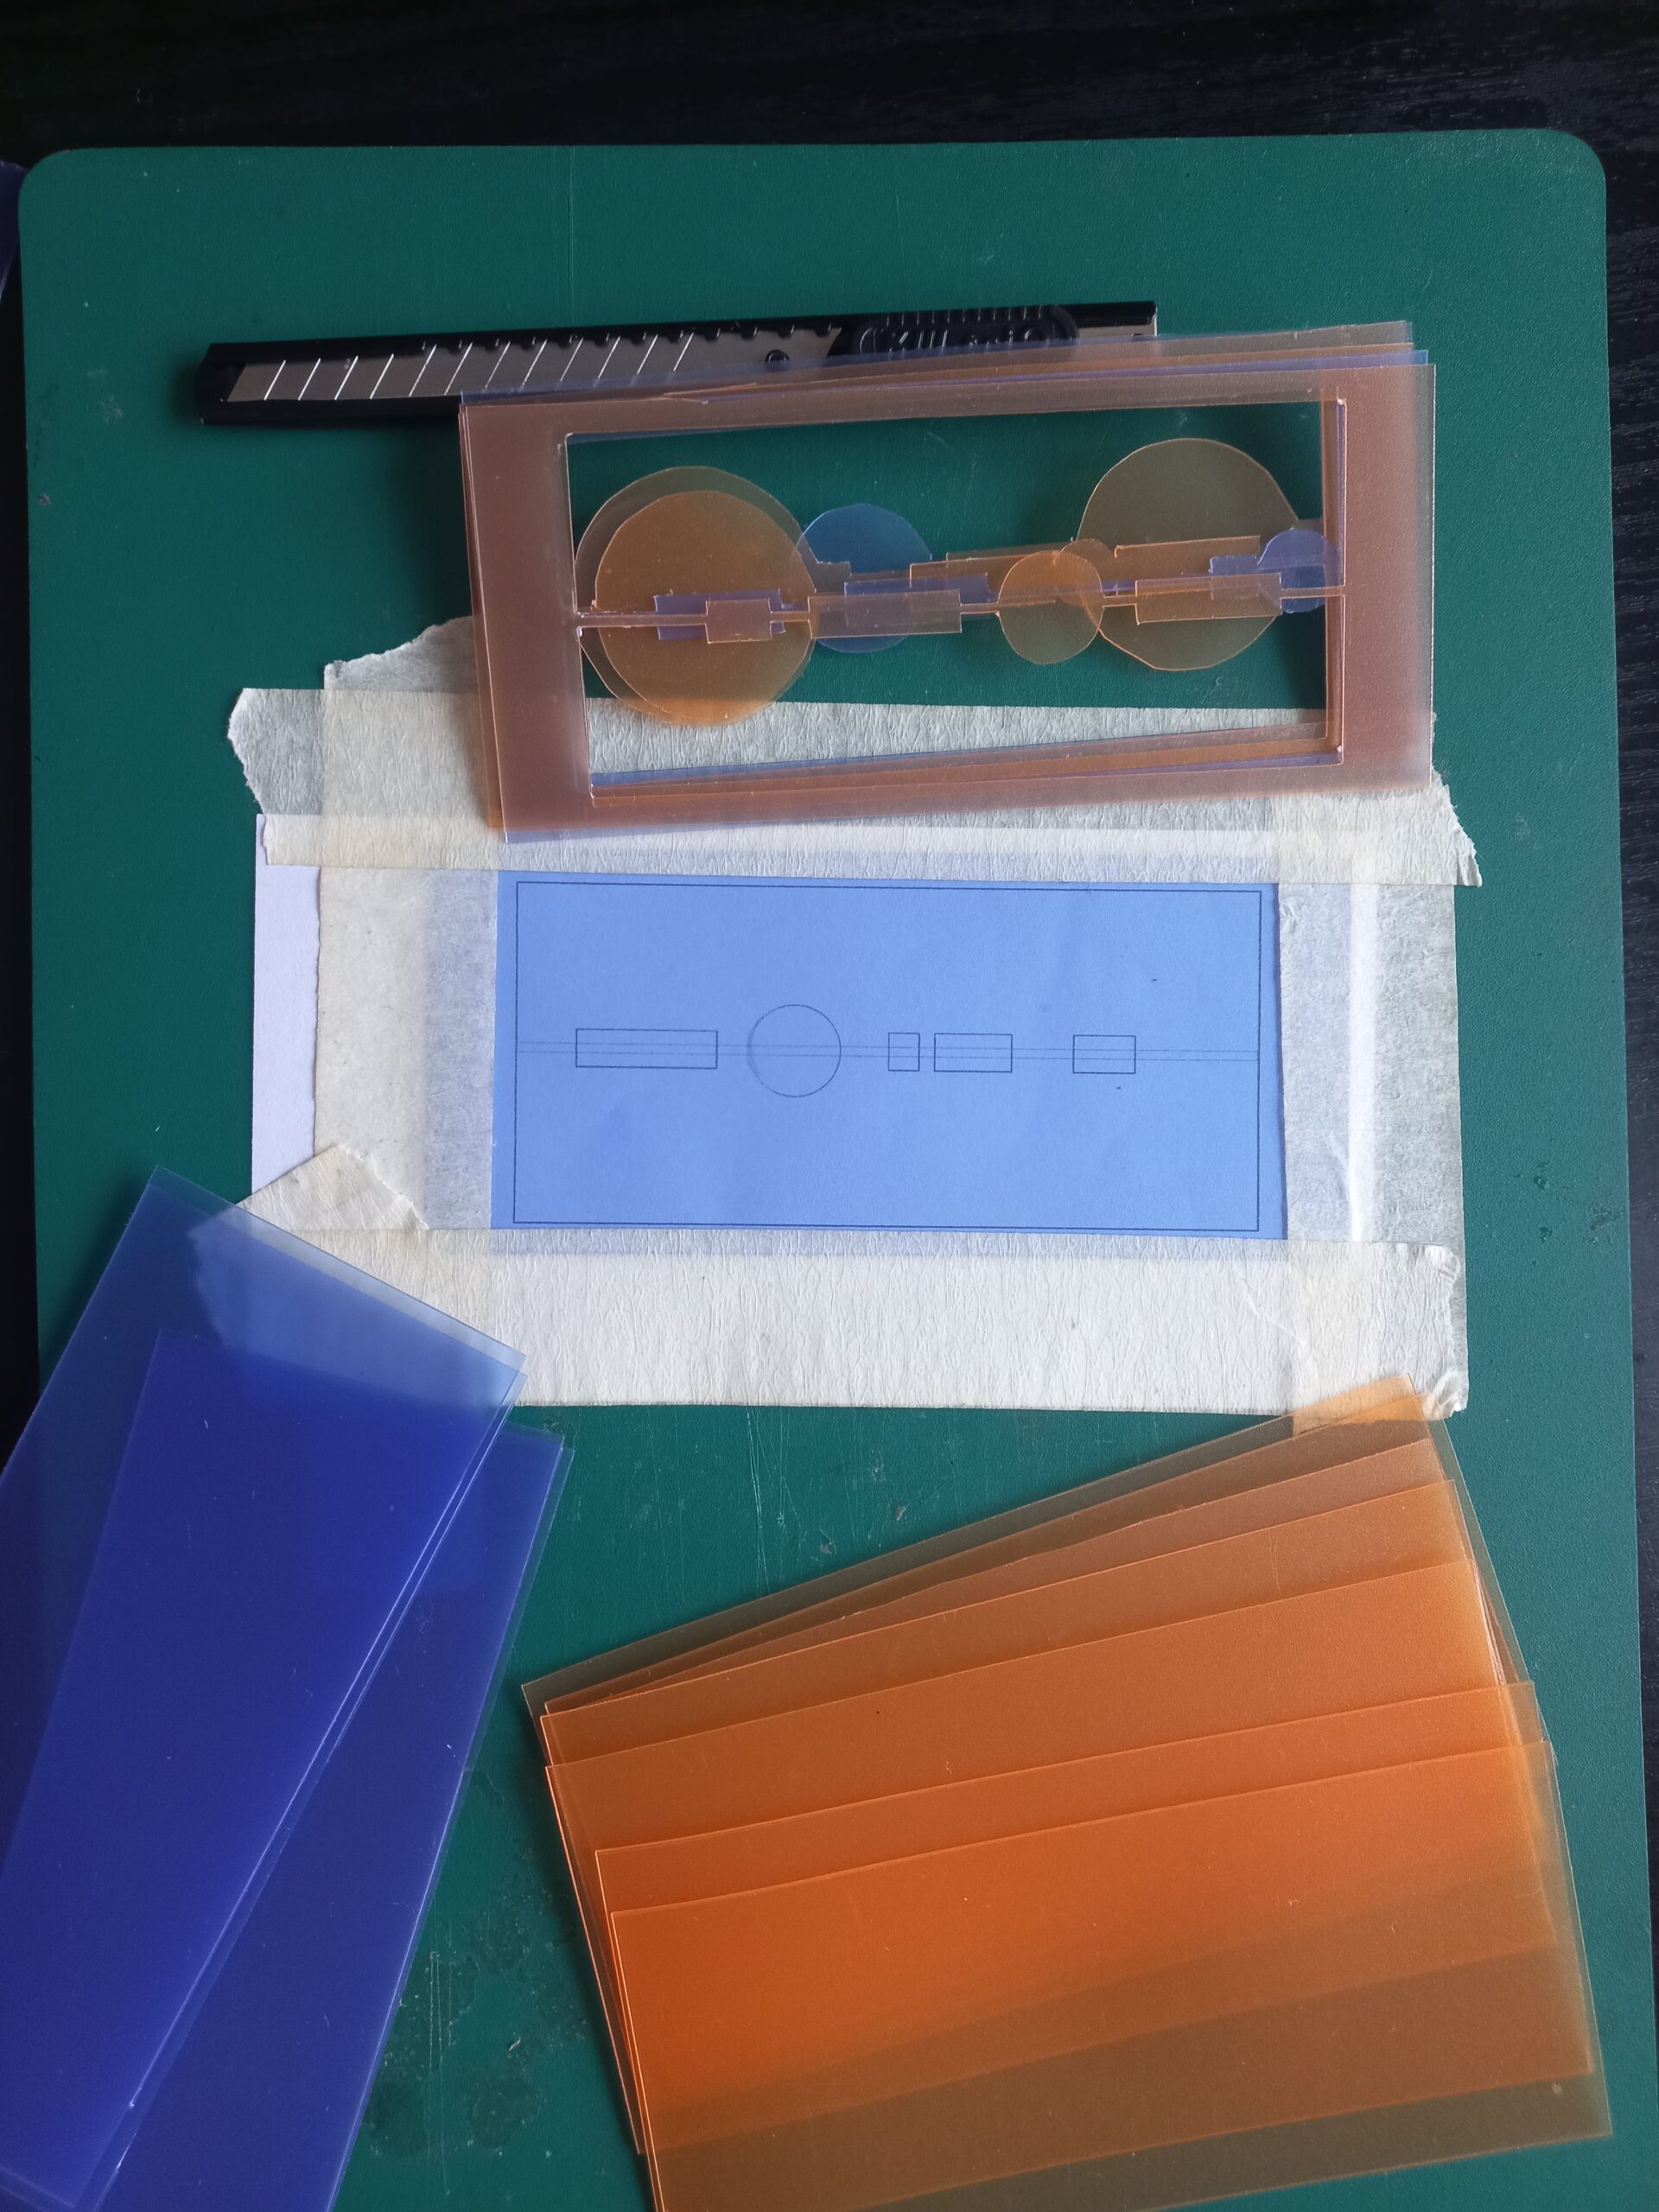
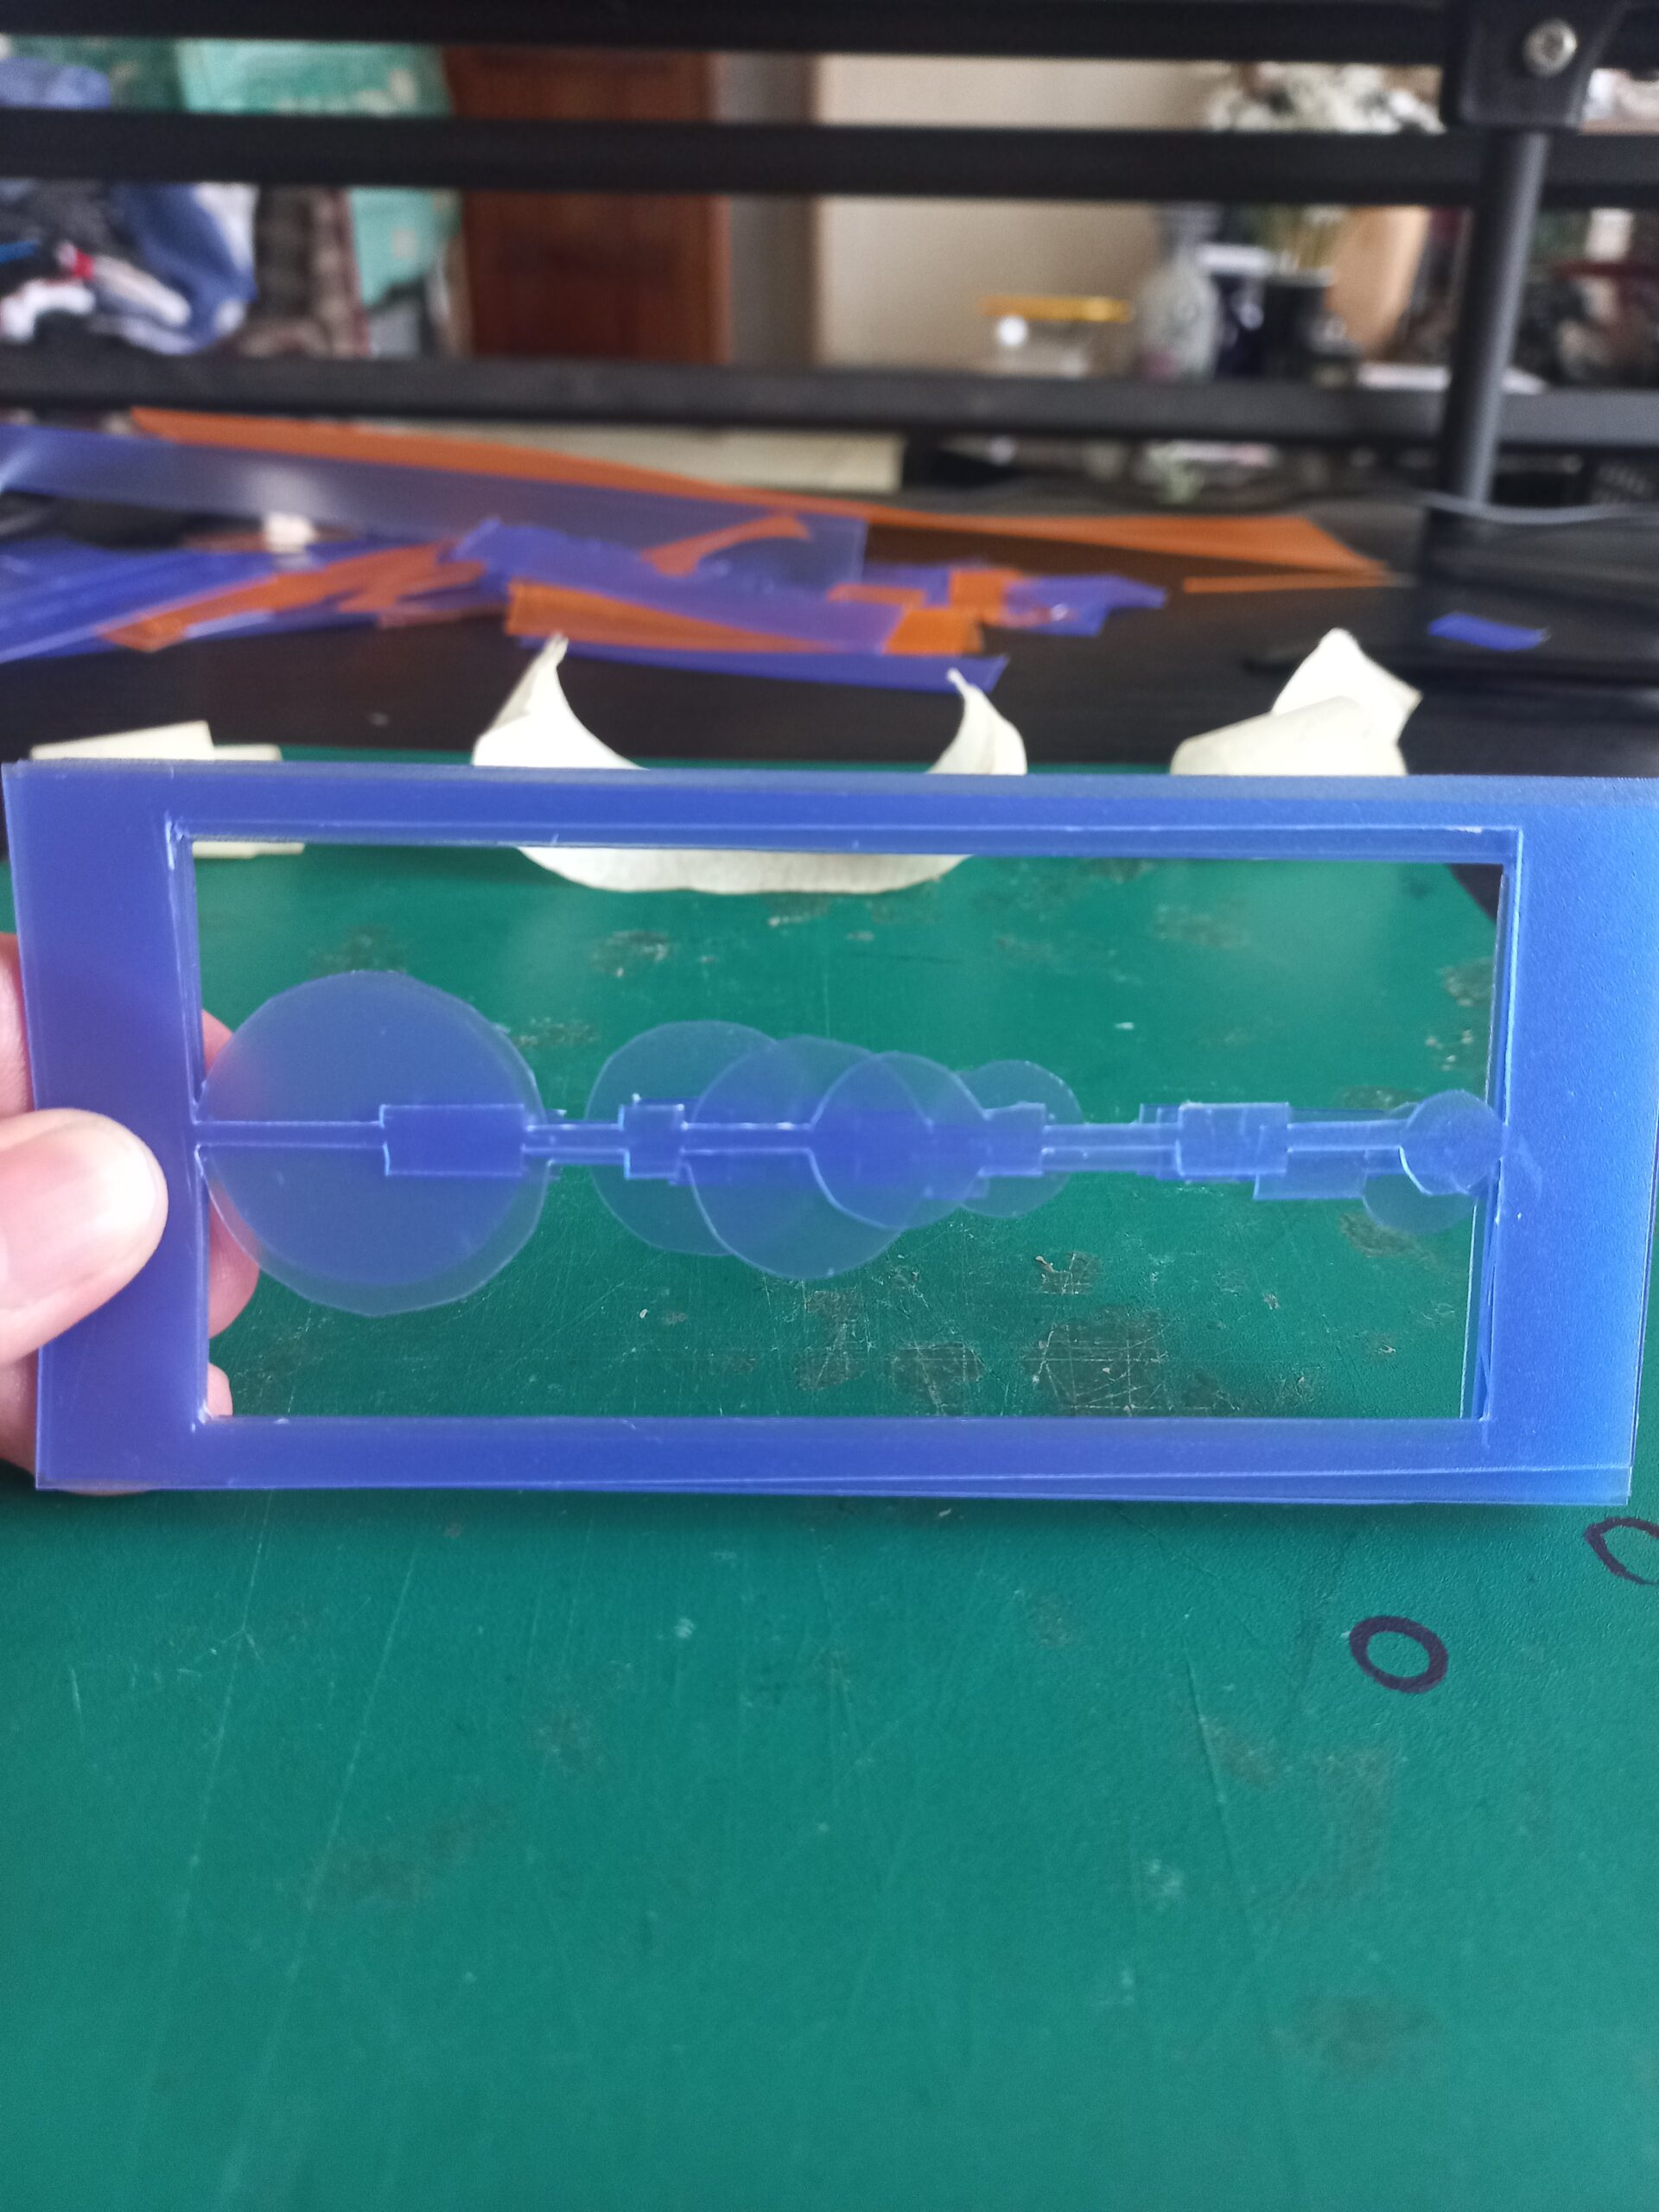
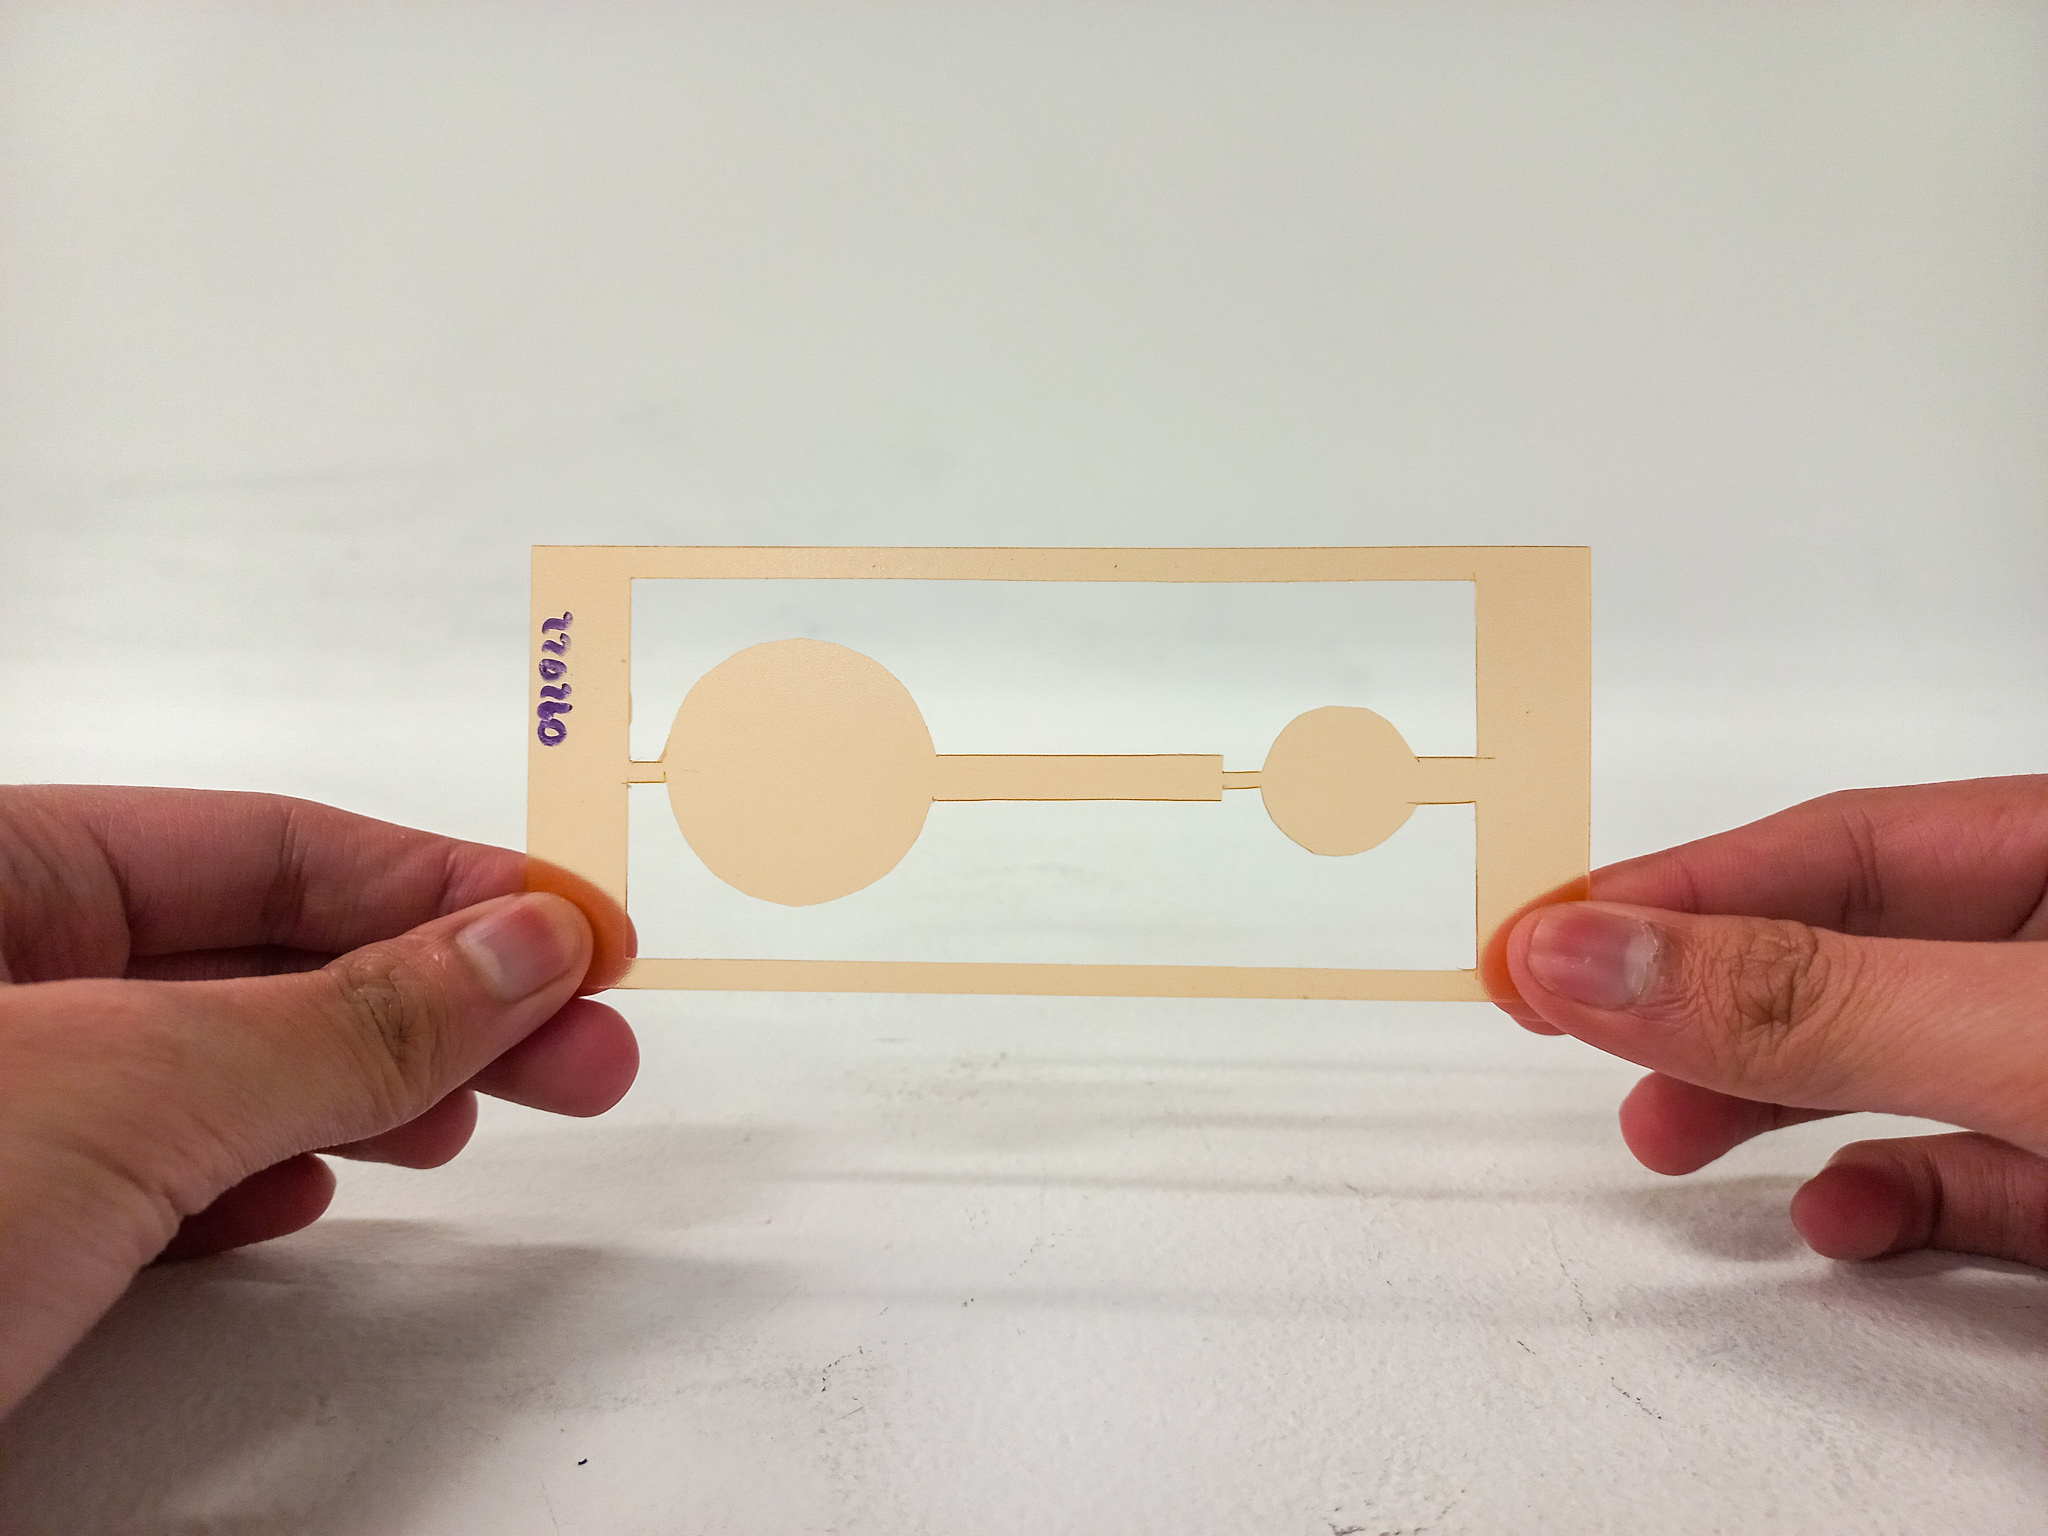
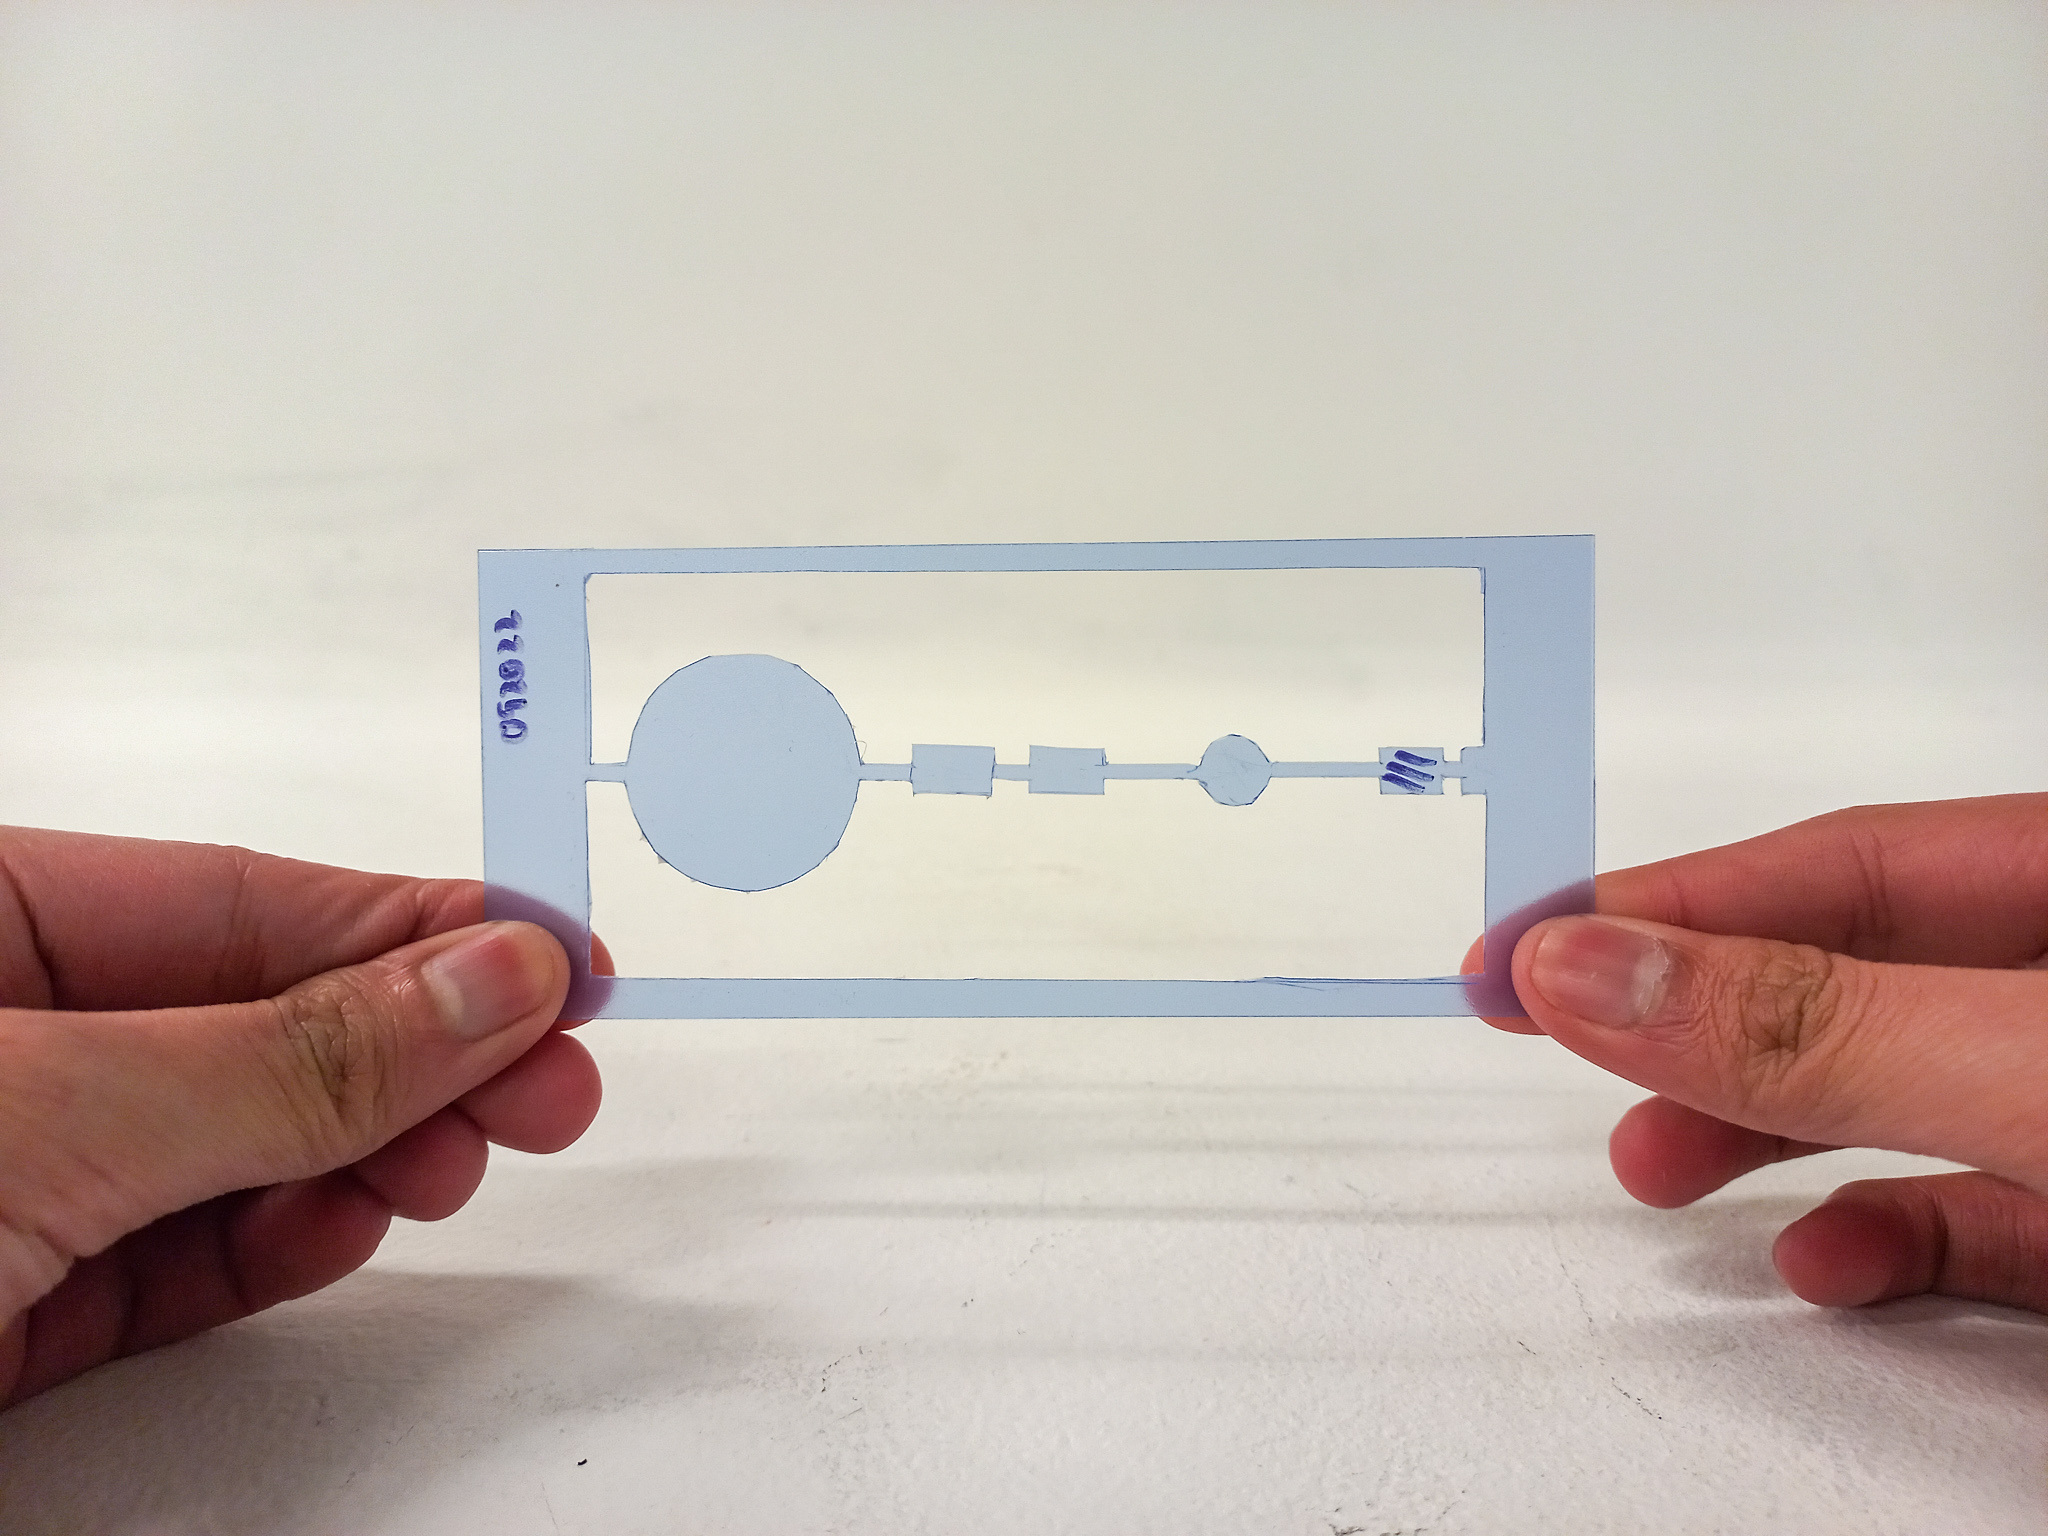
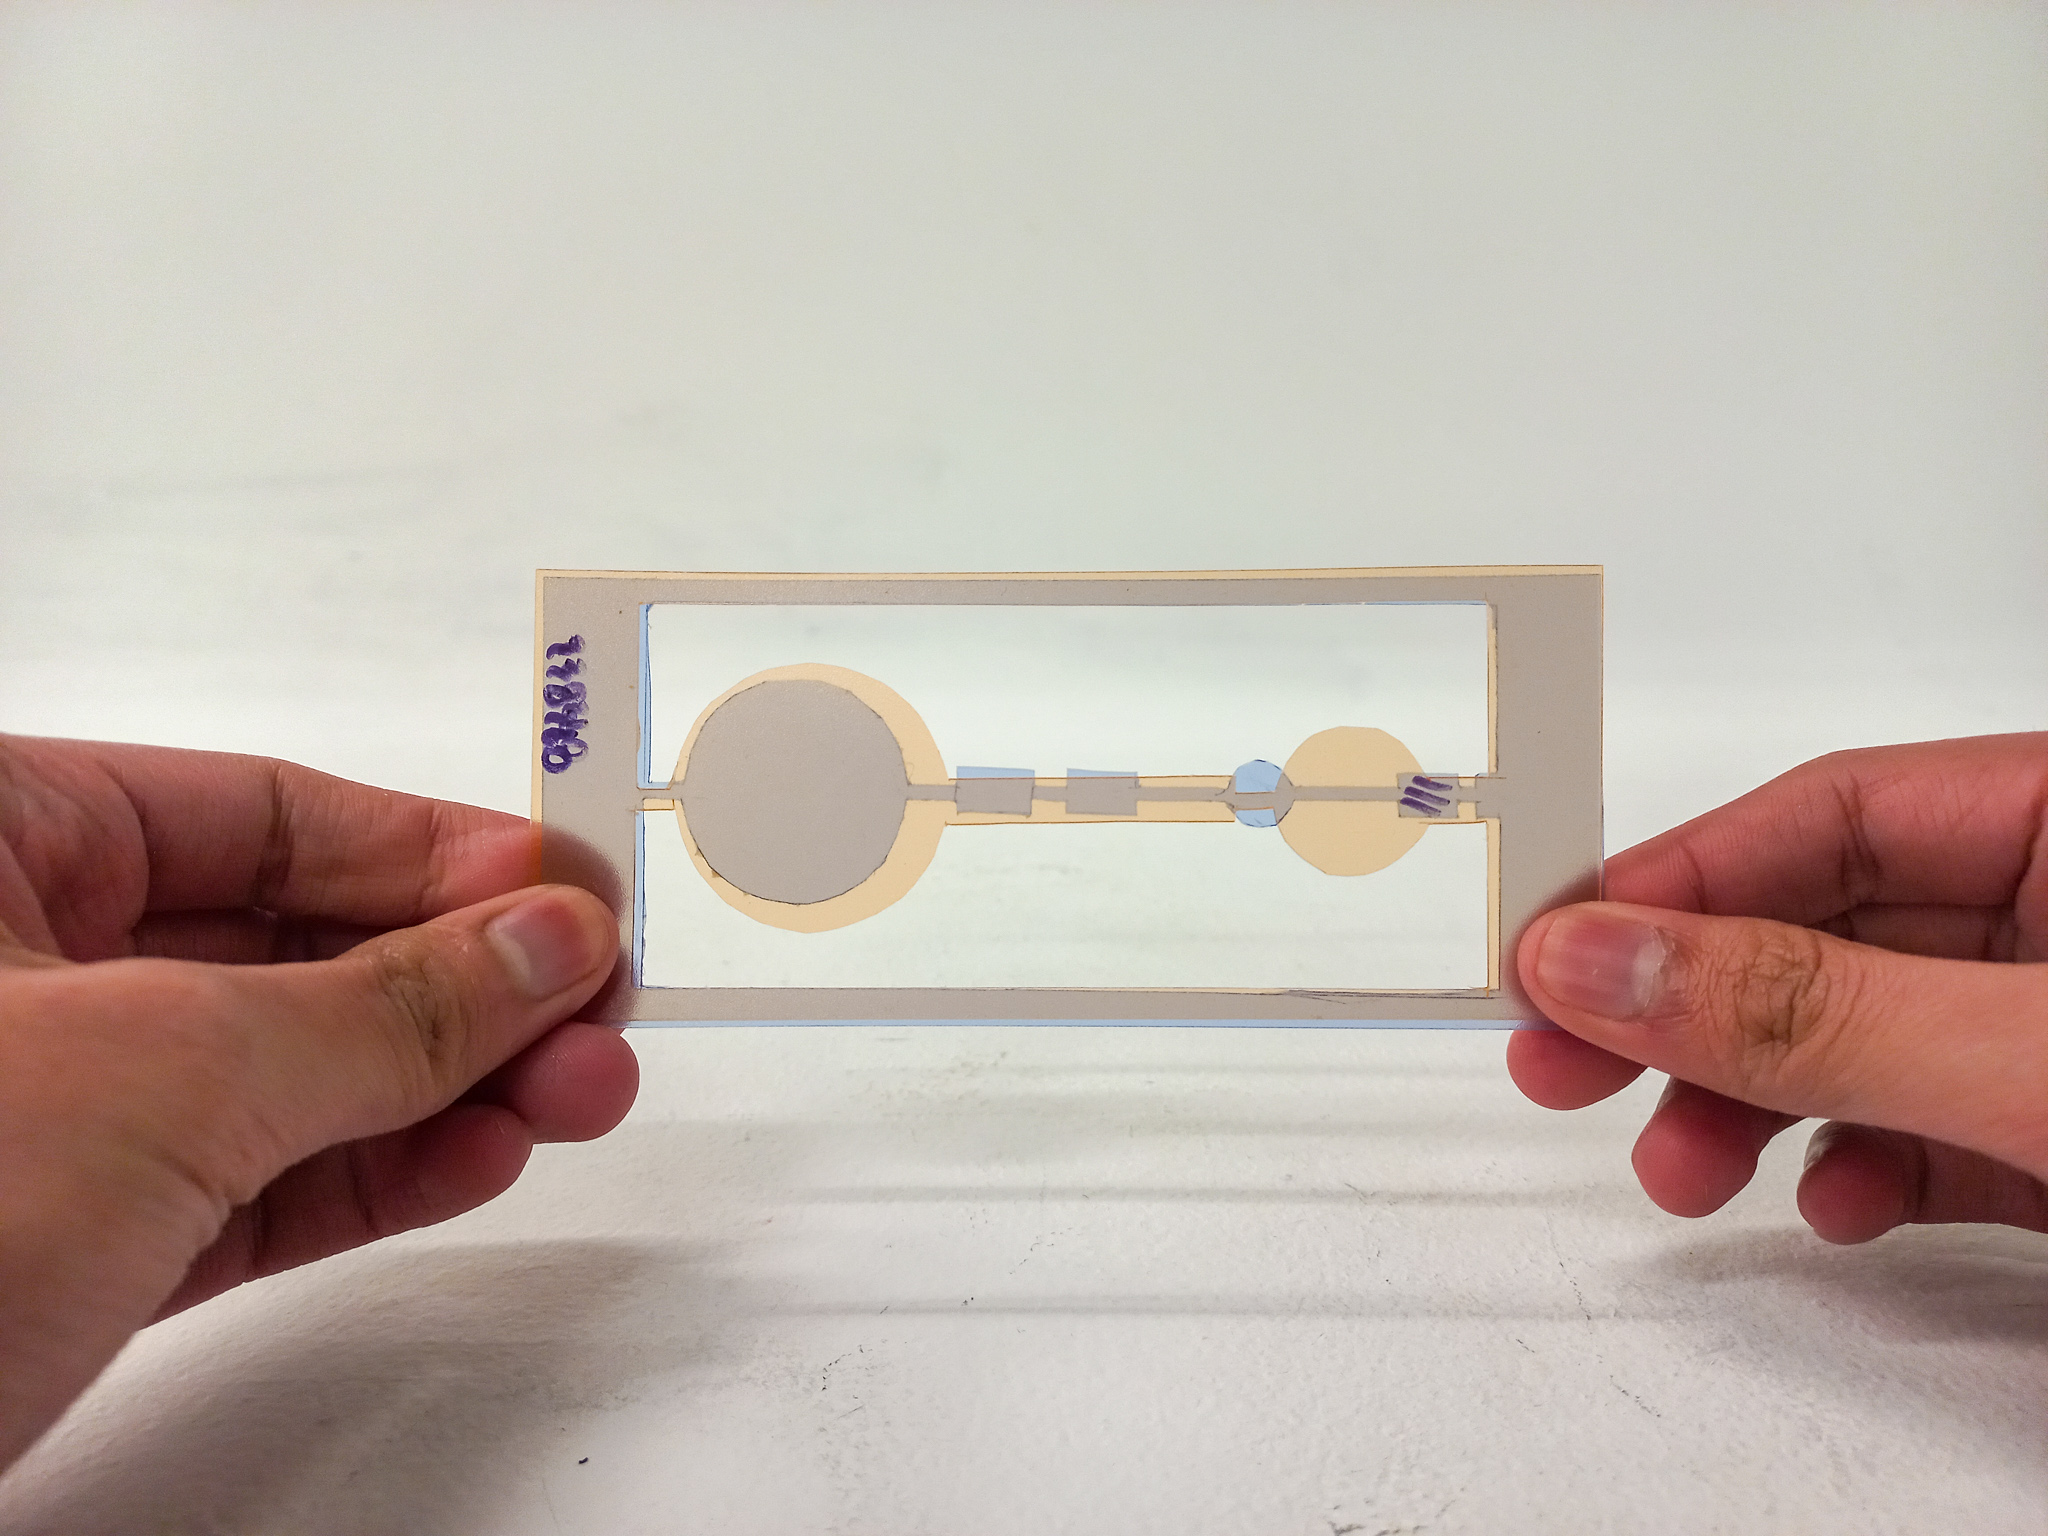
After several iterations, I have made use of transluscent card cutouts to showcase the data collected. This entails being able to create stencil cutouts from them in the shapes of the following:
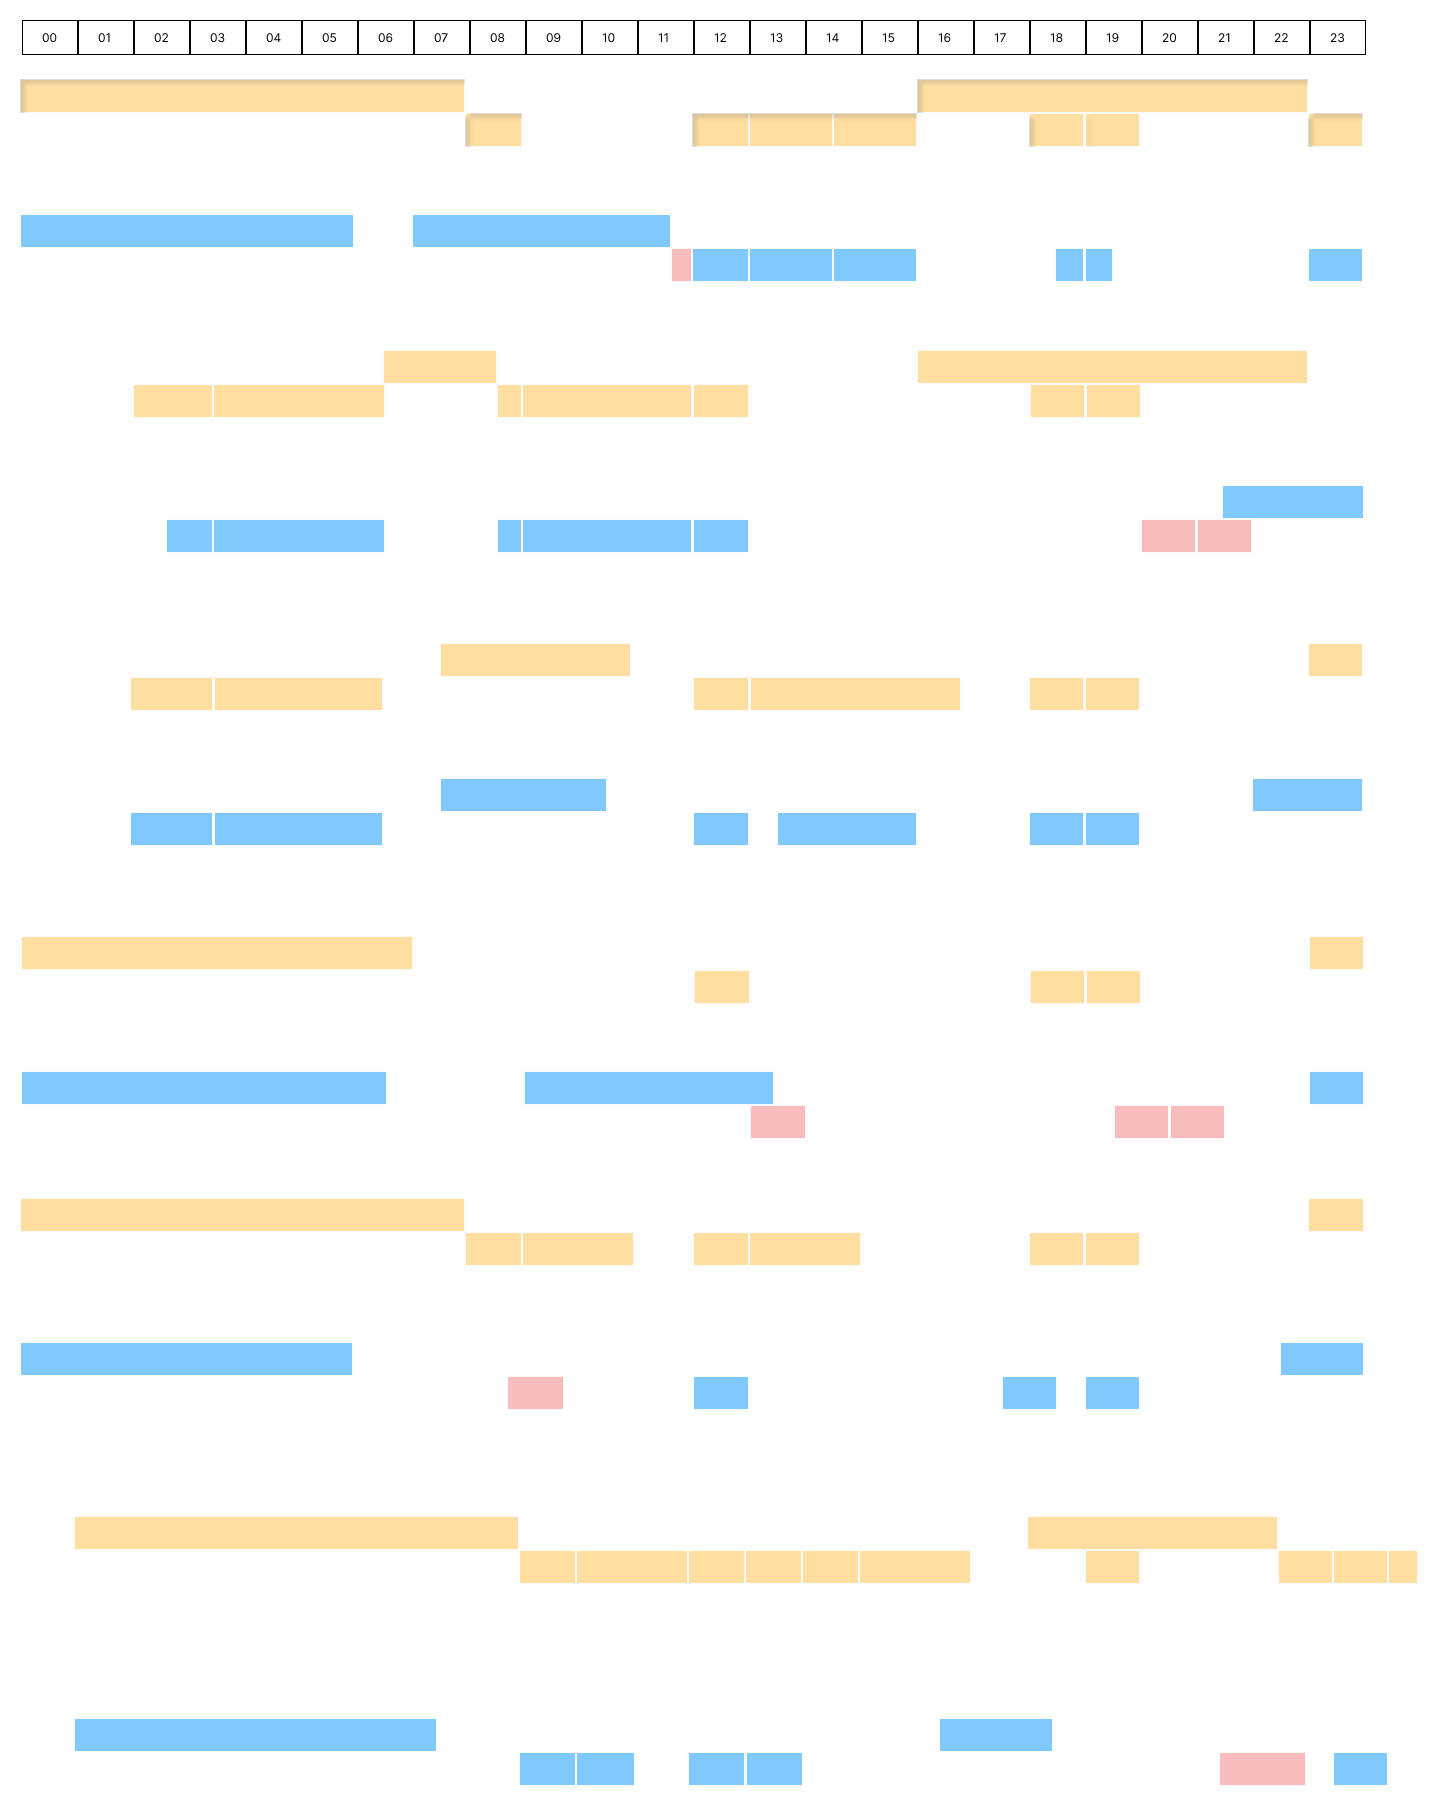
The orange cards represent the planned schedule of a day I have recorded in my calendar through time-blocking of events. The blue cards, on the other hand, represent a record of what was actually experienced throughout the day. Circles represented sleep time, while rectangles represented academic work time (both synchronous classes in Vancouver time as well as asynchronous work time for projects). Delays in schedule are marked by hatching.
Get in touch.
Do you have a project or idea in mind? Send me a message.
© Erik Asia 2025. All rights reserved.

